
Advertisement
Advertisement
EUR/USD Mid-Session Technical Analysis for August 17, 2015
By:
Daily EUR/USD Technical Analysis The EUR/USD is trading lower at the mid-session. However, the market has bounced back after early session weakness and is
Daily EUR/USD Technical Analysis
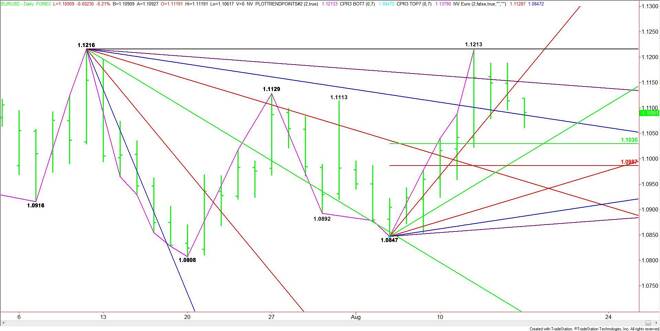
The EUR/USD is trading lower at the mid-session. However, the market has bounced back after early session weakness and is currently trading at 1.1098, which is slightly better than the mid-point of its intraday range.
On Friday, the Forex pair closed below a steep uptrending angle that had been guiding the market higher since August 5. This gave the market a downside bias on the opening. The selling was strong enough to cross to the weak side of a downtrending angle at 1.1086. However, buyers came in to recover this angle.
Based on the current price at 1.1098, the direction of the market the rest of the session will be determined by trader reaction to the angle at 1.1086.
A sustained move under 1.1086 will signal the presence of sellers. This could trigger a break into the 50% level at 1.1030. The next target under this level is an uptrending angle at 1.1007 and a Fibonacci level at 1.0987.
A sustained move over 1.1086 will signal the presence of buyers. It may be short-covering or aggressive counter-trend buying. The next upside targets are 1.1151 and 1.1167.
Watch the price action and read the order flow at 1.1086 the rest of the session.
2-Hour EUR/USD Technical Analysis
The main trend is down on the 2-Hour chart. The lower-top, lower-bottom chart pattern also indicates a downtrend. However, the closing price reversal bottom at 1.1062 suggests that momentum may be shifting to the upside.
The short-term range is 1.1188 to 1.1062. Its retracement zone at 1.1125 to 1.1140 is the primary upside target.
The intermediate range is 1.0960 to 1.1213. Its retracement zone is 1.1086 to 1.1057. This zone provided support last week at 1.1079 and a few hours ago at 1.1062.
Taking out 1.1062 will negate the reversal bottom. This could trigger breaks into the intermediate Fibonacci level at 1.1057, the major 50% level at 1.1034 and the major 61.8% level at 1.0992.
If the trend is going to continue lower then sellers are going to have to step in at 1.1125 to 1.1140.
About the Author
James Hyerczykauthor
James Hyerczyk is a U.S. based seasoned technical analyst and educator with over 40 years of experience in market analysis and trading, specializing in chart patterns and price movement. He is the author of two books on technical analysis and has a background in both futures and stock markets.


Advertisement