
Advertisement
Advertisement
EUR/USD Mid-Session Technical Analysis for August 19, 2015
By:
Daily EUR/USD Technical Analysis The EUR/USD is trading higher at the mid-session. The main trend is up according to the daily swing chart. The main range
Daily EUR/USD Technical Analysis
The EUR/USD is trading higher at the mid-session.
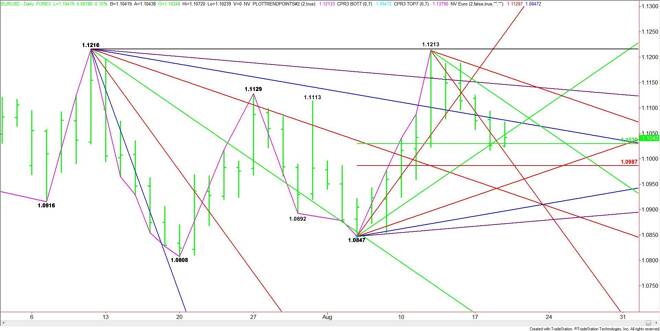
The main trend is up according to the daily swing chart. The main range is 1.0847 to 1.1213. Its retracement zone is 1.1030 to 1.0987. Yesterday, the EUR/USD stopped inside this zone at 1.1017. Earlier today, it found support at 1.1024.
The direction of the market today is likely to be determined by trader reaction to the 50% level at 1.1030.
A sustained move under 1.1030 will likely pressure the Euro into 1.1013 then the Fibonacci level at 1.0987. The daily chart opens up to the downside under 1.0987 with the next target coming in at 1.0947.
A sustained move over 1.1030 will signal the presence of buyers. Look for a labored rally while buyers try to overcome angles at 1.1047 and 1.1076. The daily chart opens up to the upside over 1.1076 with 1.1113 the next target.
Overcoming 1.1113 will be a sign of strength with the next targets coming in at 1.1146 and 1.1163.
Look for volatility at 8:30 a.m. ET with the release of the U.S. consumer inflation report. Watch the price action and read the order flow at 1.1030. This will tell us whether the bulls or the bears are in control.
2-Hour EUR/USD Technical Analysis
The main trend is down according to the 2-Hour chart.
The main range is 1.0855 to 1.1213. Its retracement zone is 1.1034 to 1.0992. The EUR/USD is currently testing the 50% level at 1.1034. Trader reaction to this level will set the tone for the session into the close.
A sustained move over 1.1034 will signal the presence of buying. The next upside target is the reversal top at 1.1072. A trade through this level will negate the chart pattern. This could trigger an acceleration into the short-term 50% level at 1.1115. This is followed by the main top at 1.1124. A trade through this level will turn the main trend to up on the 2-Hour chart. This could trigger a further rally into the Fibonacci level at 1.1138.
A sustained move under 1.1034 will signal the presence of selling. A drive through the swing bottom at 1.1017 will trigger a resumption of the downtrend. The next target is the main Fibonacci level at 1.0992.
The daily chart opens up to the downside under the Fib level at 1.0992 with the next targets main bottoms at 1.0960, 1.0924 and 1.0855.
Watch the price action and read the order flow at 1.1034. This will tell us whether the bulls or the bears are in control. Look for volatility at 8:30 a.m. ET.
About the Author
James Hyerczykauthor
James Hyerczyk is a U.S. based seasoned technical analyst and educator with over 40 years of experience in market analysis and trading, specializing in chart patterns and price movement. He is the author of two books on technical analysis and has a background in both futures and stock markets.


Advertisement