
Advertisement
Advertisement
EUR/USD Mid-Session Technical Analysis for August 20, 2015
By:
Daily EUR/USD Technical Analysis The EUR/USD is trading higher at the mid-session. This move follows yesterday’s strong surge that was fueled by the
Daily EUR/USD Technical Analysis
The EUR/USD is trading higher at the mid-session. This move follows yesterday’s strong surge that was fueled by the release of the inconclusive Fed minutes.
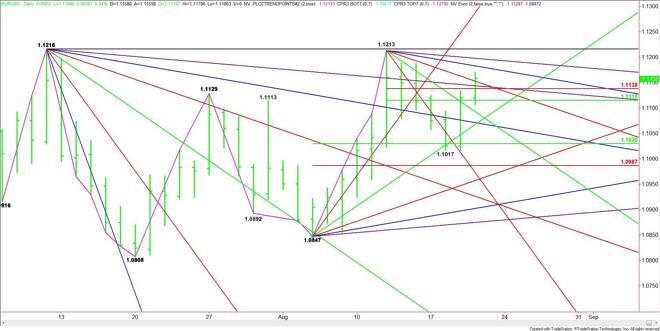
The main trend is up according to the daily swing chart. The short-term range is 1.1213 to 1.1017. The EUR/USD is currently trading on the bullish side of its retracement zone at 1.1138 to 1.1115. This area is new support today.
Today’s surge began when the 50% level at 1.1115 held as support. It accelerated when the Fib level at 1.1138 and a pair of angles at 1.1144 and 1.1153 were taken out with conviction.
The next two upside targets are downtrending angles at 1.1183 and 1.1198. These angles are followed by a pair of main tops at 1.1213 and 1.1216. Taking out these levels with conviction will reaffirm the uptrend. This could trigger an eventual rally into an uptrending angle currently at 1.1287.
On the downside, a failure to hold the 50% level at 1.1115 could trigger a break into the next major uptrending angle at 1.1067.
Based on the current price at 1.1166, look for the bullish tone to continue on a sustained move over 1.1183 and a bearish tone to develop on a sustained move under 1.1153.
2-Hour EUR/USD Technical Analysis
The main trend is up according to the 2-Hour chart. The trend turned up on a sustained move over the previous swing top at 1.1075.
Just a short while ago, the EUR/USD surged through a major Fibonacci level at 1.1138. A sustained move over this level will be bullish with the next targets 1.1188, 1.1213 and 1.1216.
A break back under 1.1138 will signal the presence of sellers. This could drive the market back into the 50% level at 1.1115.
The trigger point for an acceleration to the downside is the closing price reversal bottom at 1.1106.
About the Author
James Hyerczykauthor
James Hyerczyk is a U.S. based seasoned technical analyst and educator with over 40 years of experience in market analysis and trading, specializing in chart patterns and price movement. He is the author of two books on technical analysis and has a background in both futures and stock markets.


Advertisement