
Advertisement
Advertisement
EUR/USD Mid-Session Technical Analysis for August 4, 2015
By:
Daily EUR/USD Technical Analysis The EUR/USD is trading slightly higher at the mid-session. The main trend is down according to the daily swing chart. The
Daily EUR/USD Technical Analysis
The EUR/USD is trading slightly higher at the mid-session.
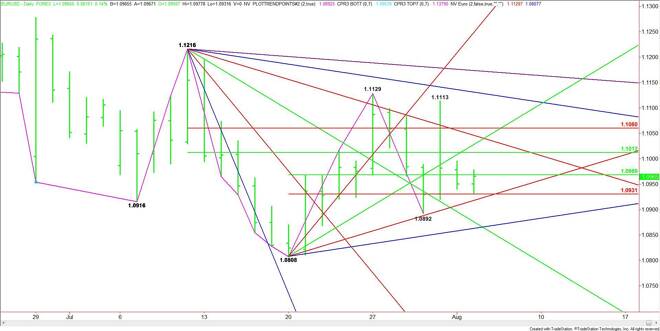
The main trend is down according to the daily swing chart. The short-term range is 1.0808 to 1.1129. Its retracement zone is 1.0969 to 1.0931. The market has been testing this range over the last five days.
The current price is 1.0965. Support is a Fibonacci level at 1.0931, followed by an uptrending angle at 1.0918. The daily chart opens up to the downside under this angle with the next targets a minor bottom at 1.0892 and another uptrending angle at 1.0863.
The first upside target is a 50% price at 1.0969. A sustained move over this level could create enough upside momentum to challenge another 50% level at 1.1012. This is followed by additional targets at 1.1028, 1.1046 and 1.1060.
Based on the current price at 1.0965, the direction of the market into the close will be determined by trader reaction to the 50% level at 1.0969.
2-Hour EUR/USD Technical Analysis
The main trend is up on the 2-Hour chart. Earlier today, the EUR/USD produced a new higher bottom at 1.0932. The previous main bottom was 1.0920. The next main bottom is 1.0893.
The current sideways to lower trade has produced a number of trading ranges and consequently a series of retracement levels which are likely to produce a labored rally until this area is cleared.
The first upside target today is a Fibonacci level at 1.0977. This price was tested earlier in the session. A sustained move over this level could create enough upside momentum to challenge a series of 50% levels at 1.1003, 1.1011 and 1.1023. This area is followed by a pair of Fibonacci levels at 1.1039 to 1.1044.
Based on the current price at 1.0965, the direction of the market into the close will be determined by trader reaction to the Fib level at 1.0977.
A sustained move over 1.0977 will signal the presence of buyers. This could trigger a rally into at least 1.1003. Look for a labored rally until 1.1044 is taken out with conviction. This price is the trigger point for a strong surge to the upside.
Look for a bearish tone to develop if sellers come in to defend 1.0977. Taking out 1.0932 will change the main trend to down with targets at 1.0920 and 1.0893.
Watch and read the price action and order flow at 1.0977 today. This will tell us whether the bulls or the bears are in control.
About the Author
James Hyerczykauthor
James Hyerczyk is a U.S. based seasoned technical analyst and educator with over 40 years of experience in market analysis and trading, specializing in chart patterns and price movement. He is the author of two books on technical analysis and has a background in both futures and stock markets.


Advertisement