
Advertisement
Advertisement
EUR/USD Mid-Session Technical Analysis for November 16, 2015
By:
Daily EUR/USD Technical Analysis The EUR/USD is trading lower at the mid-session. The Forex pair sold-off shortly after the opening in reaction to the
Daily EUR/USD Technical Analysis
The EUR/USD is trading lower at the mid-session. The Forex pair sold-off shortly after the opening in reaction to the events in Paris over the week-end. The EUR/USD could weaken throughout the day if safe-haven buying resumes or if there are heightened geopolitical risks.
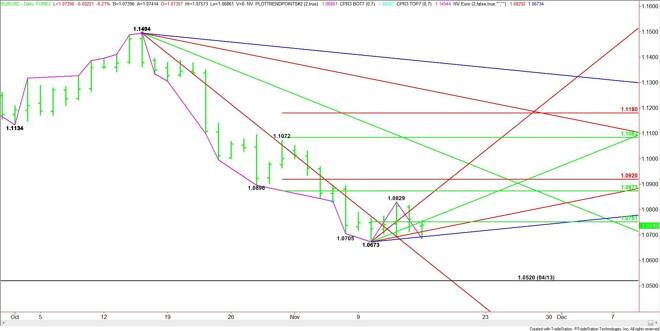
Technically, the main trend is down according to the daily swing chart. The overnight price action has helped form a new main range between 1.0673 and 1.0829. Its 50% or pivot is 1.0751. This price appears to be controlling the short-term direction of the market.
A sustained move under 1.0751 will indicate the presence of selling. The next two targets are uptrending angles at 1.0713 and 1.0693. These are followed by the main bottom at 1.0673.
A trade through 1.0673 will signal a resumption of the downtrending. This could trigger a further break into a steep downtrending angle at 1.0614.
The key area on the upside is a combination pivot at 1.0751 and an uptrending angle at 1.0753. Overtaking this area will signal the presence of buyers with the first potential target a main top at 1.0829.
Taking out 1.0829 will change the main trend to up. Holding above the steep angle at 1.0833 will be a sign of strength. This could trigger a further move into a retracement zone at 1.0873 to 1.0920.
Watch the price action and read the order flow at 1.0751. Trader reaction to this level will tell us whether the bulls or the bears are in control.
2-Hour EUR/USD Technical Analysis
The main trend is down according to the 2-Hour EUR/USD swing chart.
The short-term range is 1.0769 to 1.0686. Its 50% level or pivot is 1.0728. Trader reaction this level should set the tone into the close.
A sustained move over 1.0728 will signal the presence of buyers. This could create enough upside momentum to challenge the main top at 1.0769. A trade through this level will turn the main trend to up. The next two targets over this top are a 50% level at 1.0785 and a Fibonacci level at 1.0811.
A sustained move under 1.0728 will indicate the presence of sellers. The next break could be labored because of a series of bottoms at 1.0690, 1.0686 and 1.0673. Taking out 1.0673 could lead to the start of another leg down with the next target 1.0520.
Watch the price action and read the order flow at 1.0728 on the 2-Hour chart. This will tell us whether the bulls or the bears are in control.
About the Author
James Hyerczykauthor
James Hyerczyk is a U.S. based seasoned technical analyst and educator with over 40 years of experience in market analysis and trading, specializing in chart patterns and price movement. He is the author of two books on technical analysis and has a background in both futures and stock markets.


Advertisement