
Advertisement
Advertisement
EUR/USD Mid-Session Technical Analysis for November 19, 2015
By:
Daily EUR/USD Technical Analysis The EUR/USD is trading higher at the mid-session. This rally represents a follow-through move fueled by yesterday’s
Daily EUR/USD Technical Analysis
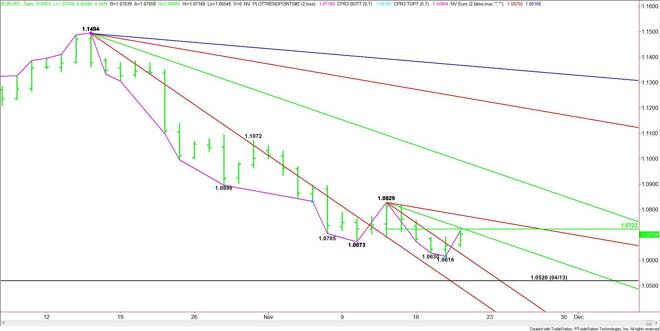
The EUR/USD is trading higher at the mid-session. This rally represents a follow-through move fueled by yesterday’s closing price reversal bottom. The momentum created by this chart pattern also led to a breakout over a short-term angle that had recently provided resistance.
The main trend is down according to the daily swing chart, however, momentum has shifted to the upside.
The new short-term range is 1.0829 to 1.0616. Its 50% level at 1.0722 and a downtrending angle at 1.0729 are the best upside targets and potential breakout levels. Since the trend is down, sellers may come in on the first test of this area. However, if buyers can take out 1.0729 then the rally may extend into 1.0779.
Taking out 1.0779 will put the market in a position to challenge the main top at 1.0829. Taking out this top will change the main trend to up.
The inability to take out 1.0722 and a sustained move under this angle will indicate the presence of sellers. This could lead to a test of 1.0629 and the main bottom at 1.0616.
Taking out 1.0616 will signal a resumption of the downtrend. The next target under this bottom is the April 13 main bottom at 1.0520.
Watch the price action and read the order flow at 1.0722 to 1.0729 the rest of the session. Trader reaction to this zone will tell us whether the bulls or the bears are in control.
2-Hour EUR/USD Technical Analysis
The main trend is up according to the 2-Hour EUR/USD swing chart.
The main range is 1.0829 to 1.0616. Its retracement zone is 1.0722 to 1.0748. This zone is the primary upside target.
The intermediate range is 1.0769 to 1.0616. Its retracement zone is 1.0693 to 1.0711. This zone is currently providing resistance.
The short-term range is 1.0616 to 1.0717. Its 50% level or pivot is 1.0667. This zone is providing support.
Based on the current price at 1.0702, a sustained move over 1.0693 will signal the presence of buyers. However, a rally is likely to be labored because of a series of potential resistance levels at 1.0711, 1.0717, 1.0722 and 1.0748.
Look for the rally to start to expand on a sustained move over 1.0748.
A sustained move under 1.0693 will indicate the presence of sellers. This could lead to a steep drop back to the pivot at 1.0667.
The 2-hour chart opens up to the downside under 1.0667 with the next potential target the main bottom at 1.0616.
Basically, look for an upside bias on a sustained move over 1.0711 and a downside bias on a sustained move under 1.0693.
About the Author
James Hyerczykauthor
James Hyerczyk is a U.S. based seasoned technical analyst and educator with over 40 years of experience in market analysis and trading, specializing in chart patterns and price movement. He is the author of two books on technical analysis and has a background in both futures and stock markets.


Advertisement