
Advertisement
Advertisement
EUR/USD Mid-Session Technical Analysis for November 3, 2015
By:
Daily EUR/USD Technical Analysis The EUR/USD is trading lower at the mid-session. The main trend is down according to the daily swing chart. The
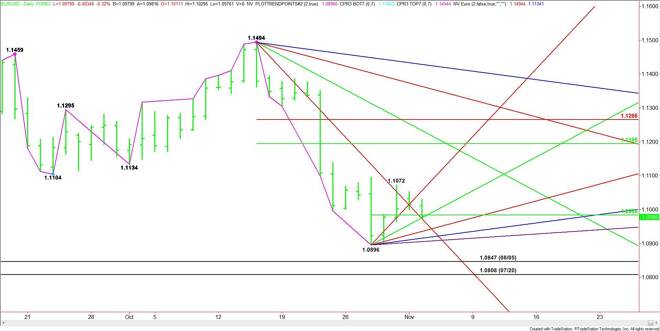
Daily EUR/USD Technical Analysis
The EUR/USD is trading lower at the mid-session.
The main trend is down according to the daily swing chart.
The short-term range is 1.0896 to 1.1072. Its 50% level or pivot is 1.0984. This pivot is controlling the short-term direction of the market.
The current price is 1.0982.
A sustained move over 1.0984 will indicate the presence of buyers. The first upside objective is the intraday high at 1.1029. This is followed by a steep uptrending angle at 1.1056. Crossing to the strong side of this angle will put the EUR/USD in a bullish position.
A sustained move under 1.0984 will signal the presence of sellers. The first target is an uptrending angle at 1.0976. This is followed by a steep downtrending angle at 1.0974.
Crossing to the weak side of the angle at 1.0974 will put the EUR/USD in a bearish position with the next downside target an uptrending angle at 1.0936.
The last two uptrending angles before the 1.0896 main bottom come in at 1.0916 and 1.0906.
Watch the price action and read the order flow at 1.0984. Trader reaction to this level will tell us if the bulls or the bears are in control. A sustained move over 1.0984 will give the market a bullish tone into the close. A sustained move under 1.0984 will give the market a bearish tone into the close.
2-Hour EUR/USD Technical Analysis
The main trend is down according to the 2-Hour Swing Chart.
The main range is 1.1095 to 1.0896. Its retracement zone is 1.0996 to 1.1019.
The short-term range is 1.0896 to 1.1072. Its retracement zone is 1.0984 to 1.0963.
The current price is 1.0982.
Trader reaction to the 50% level at 1.0984 will determine the direction of the EUR/USD into the close.
A sustained move over 1.0984 will signal the presence of buyers. This may create enough upside momentum to test the main 50% level at 1.0996.
The EUR/USD could accelerate to the upside on a sustained move over 1.0996 with the next target the main Fibonacci level at 1.1019. This is also a trigger point for a surge to the upside with potential targets at 1.1072 and 1.1095.
A sustained move under 1.0984 will indicate the presence of sellers. This could trigger a break into the short-term Fibonacci level at 1.0963.
The Fib level is also a trigger point for the start of a steep break down with 1.0896 a potential target over the near-term.
Hourly traders like the daily traders need to watch the price action and order flow at 1.0984 the rest of the session. Trader reaction to this level will tell us whether the bulls or the bears are in control.
About the Author
James Hyerczykauthor
James Hyerczyk is a U.S. based seasoned technical analyst and educator with over 40 years of experience in market analysis and trading, specializing in chart patterns and price movement. He is the author of two books on technical analysis and has a background in both futures and stock markets.


Advertisement