
Advertisement
Advertisement
EUR/USD Mid-Session Technical Analysis for October 16, 2014
By:
Daily EUR/USD Technical Analysis The main trend turned up on Wednesday when the EUR/USD took out the swing top at 1.2791. The new main bottom is 1.2624. A
Daily EUR/USD Technical Analysis
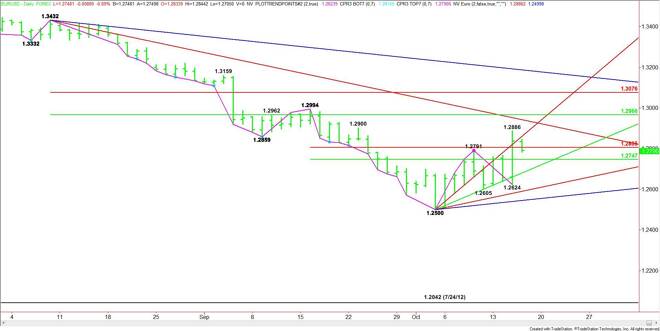
The main trend turned up on Wednesday when the EUR/USD took out the swing top at 1.2791. The new main bottom is 1.2624. A trade through this price will turn the main trend to down.
The short-term range is 1.2994 to 1.2500. The retracement zone of this range at 1.2747 to 1.2805 is the key support area today. Trader reaction to this zone should set the tone for the day.
On the downside, the support angle to watch is 1.2680.
On the upside, overcoming a steep uptrending angle at 1.2860 will be the first sign of strength. This could trigger a rally into the long-term downtrending angle at 1.2942.
The main range is 1.3432 to 1.2500. Its retracement zone at 1.2966 to 1.3076 is the next likely upside target. Overtaking the downtrending angle at 1.2942 could trigger a rally into this retracement area.
Holding 1.2805 will give the market a bullish bias into the close while a sustained move under 1.2747 will indicate weakness.
Hourly EUR/USD Technical Analysis
The main trend is up on the hourly chart. The main trend turned up on Wednesday when the EUR/USD crossed 1.2669.
The main range is 1.2637 to 1.2886. The retracement zone formed by this range at 1.2761 to 1.2732 is a key area to watch. Earlier today, sellers took out the lower or Fibonacci level at 1.2732 on its way to 1.2705.
The subsequent rally from 1.2705 helped traders regain the Fibonacci level at 1.2732. This price is new intraday support.
A new short-term range is 1.2844 to 1.2705. The retracement zone formed by this range is 1.2775 to 1.2791.
Trader reaction to the 50% levels at 1.2761 and 1.2775 will set the tone for the session. Holding above 1.2775 will be bullish. A failure at 1.2761 will be bearish.
About the Author
James Hyerczykauthor
James Hyerczyk is a U.S. based seasoned technical analyst and educator with over 40 years of experience in market analysis and trading, specializing in chart patterns and price movement. He is the author of two books on technical analysis and has a background in both futures and stock markets.


Advertisement