
Advertisement
Advertisement
EUR/USD Mid-Session Technical Analysis for October 2, 2014
By:
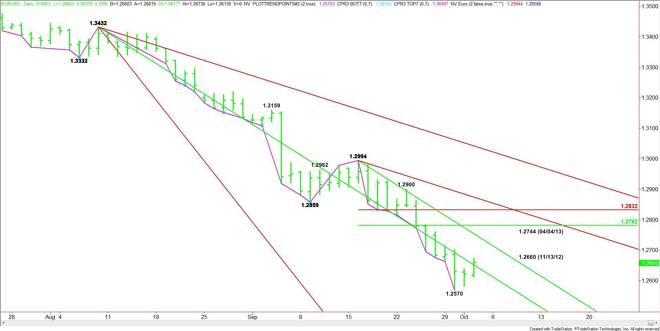
Daily EUR/USD Technical Analysis The EUR/USD is trading higher at the mid-session. Shorts appear to be covering after a prolonged down and after the
Daily EUR/USD Technical Analysis
The EUR/USD is trading higher at the mid-session. Shorts appear to be covering after a prolonged down and after the European Central Bank gave traders what they were looking for.
Today, the Forex pair is trading on the bullish side of a downtrending angle at 1.2652. It’s down this before so a sustained move but failed so a sustained move through this price will indicate developing strength.
The next upside target is another downtrending angle from the 1.2994 top at 1.2754.
A new short-term range may be forming between 1.2994 and 1.2570. Completing a normal retracement of this range means 1.2782 to 1.2832 will be tested.
Hourly EUR/USD Technical Analysis
The main trend is up on the hourly chart. The new swing bottom is 1.2613. A trade through this level will turn the main trend back to down.
The main range is the September 23 top at 1.2900 and the September 30 bottom at 1.2570. Its retracement zone at 1.2735 to 1.2774 is the next major upside target.
A new short-term range has formed between 1.2570 and 1.2674. Its retracement zone at 1.2622 to 1.2610 is providing support today. Trader reaction to this zone will set the tone for the day. The swing bottom at 1.2613 also falls inside this zone.
Taking out 1.2610 will put the market in a bearish position into the close. Holding above the 50% level at 1.2622 could trigger a bullish response into the close.
If a new secondary higher bottom is formed at 1.2622 to 1.2610 then enough upside momentum may be created to drive the market into at least 1.2735 over the next two sessions.
If the EUR/USD is turning higher the start to watch for a series of higher-tops and higher-bottoms. Lower-tops and lower-bottoms will mean the trend is down or getting ready to turn lower.
About the Author
James Hyerczykauthor
James Hyerczyk is a U.S. based seasoned technical analyst and educator with over 40 years of experience in market analysis and trading, specializing in chart patterns and price movement. He is the author of two books on technical analysis and has a background in both futures and stock markets.


Advertisement