
Advertisement
Advertisement
EUR/USD Mid-Session Technical Analysis for October 31, 2014
By:
Daily EUR/USD Technical Analysis After early session weakness, the EUR/USD is recovering but still trading lower. Traders appear to be adopting a neutral
Daily EUR/USD Technical Analysis
After early session weakness, the EUR/USD is recovering but still trading lower. Traders appear to be adopting a neutral stance, following the report of better-than-expected Euro Zone inflation. According to this morning’s European Union statistics office release, consumer prices rose 0.4 percent from a year earlier. This was in line with the estimates and slightly better than the September reading of 0.3 percent.
So with the data giving the European Central Bank policymakers a little reprieve from further stimulus, early indications are that traders have lost the main reason to press the Euro lower over the near-term. This could lead to the start of a short-covering rally.
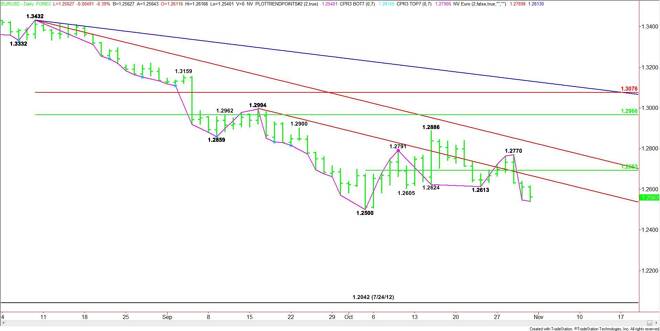
The short-term range is 1.2500 to 1.2886. The mid-point of this range is 1.2603. This price is controlling the short-term direction of the market. If there is going to be a short-covering rally then it won’t be noticed until 1.2603 is recovered. At this time, the incentive to drive this market through 1.2500 may be off the table, but unless 1.2603 is recovered, the bias will remain on the downside.
The first upside target today is a downtrending angle at 1.2631, followed by the pivot at 1.2603 and another angle at 1.2832. The major support is the October 3 bottom at 1.2500.
Hourly EUR/USD Technical Analysis
The main trend is down on the hourly chart, but the closing price reversal bottom at 1.2540 suggests the low of the day may have been put in.
The short-term range is 1.2632 to 1.2540. The retracement zone of this range is 1.2586 to 1.2597. This zone is currently being tested. Trader reaction to this zone should set the tone for the session.
Overtaking the upper or Fibonacci level at 1.2597 will be bullish. This could create enough upside momentum to take out 1.2603. This would turn the main trend to up on the hourly chart.
A failure at the retracement zone will be bearish. Look for selling pressure if 1.2586 becomes resistance.
About the Author
James Hyerczykauthor
James Hyerczyk is a U.S. based seasoned technical analyst and educator with over 40 years of experience in market analysis and trading, specializing in chart patterns and price movement. He is the author of two books on technical analysis and has a background in both futures and stock markets.


Advertisement