EUR/USD Technical Analysis
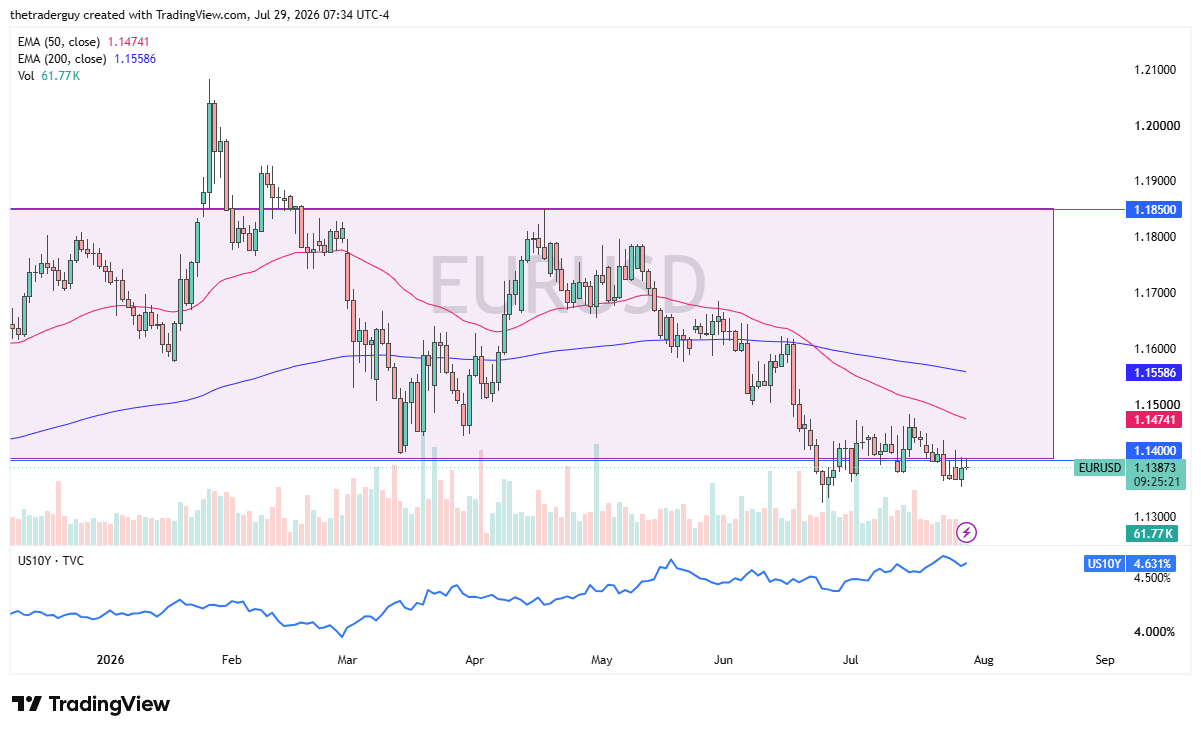
The euro initially rallied a bit during the trading session on Wednesday but continues to see a lot of noise right around the 1.14 level. There is about a 40% chance based on the FedWatch tool that the Federal Reserve is going to hike rates, and that means that a certain number of traders are going to be disappointed regardless of what happens. With that being said, the market is likely to continue to be one that is going to be choppy.
The market has been decidedly negative for a while, and if the Federal Reserve sounds hawkish, then one would assume that the US dollar should strengthen. We will just have to wait and see. Rallies at this point in time will be facing the 50-day EMA at 1.1475. To the downside, the 1.1350 level is short-term support, and ultimately, this is a market that very well could be a mover today.

USD/CAD Technical Analysis
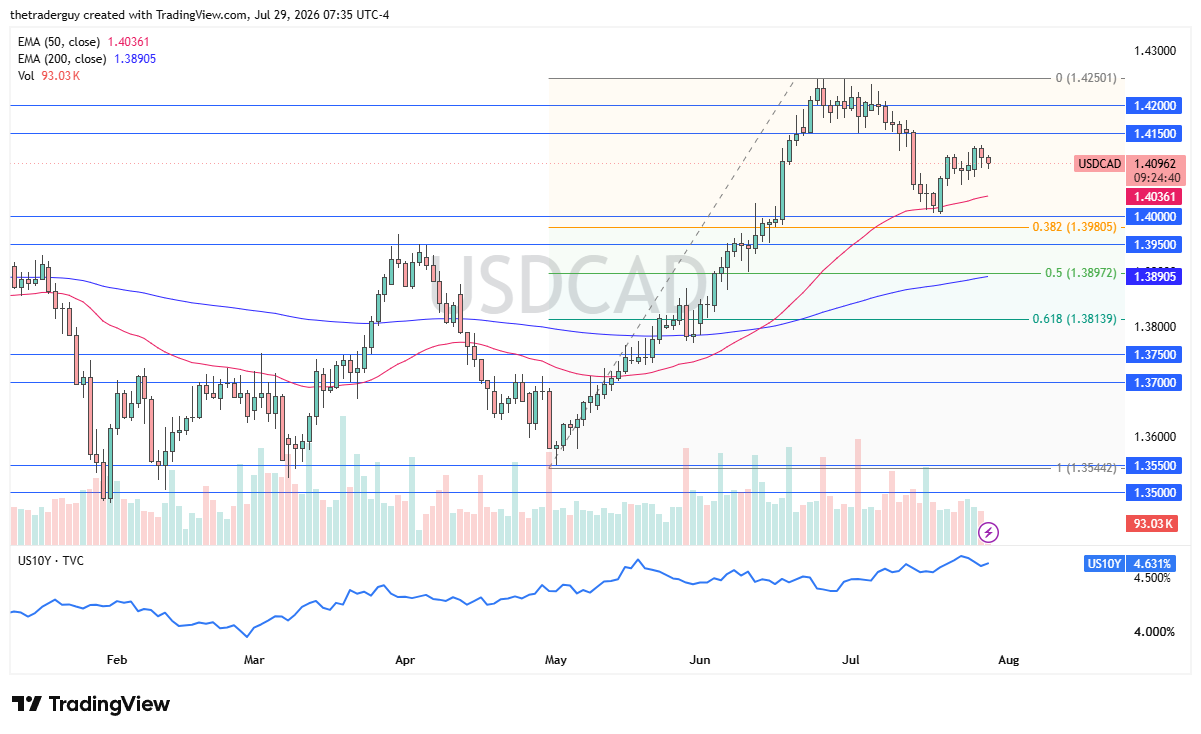
The US dollar pulled back just a bit during the early part of the trading session, but turned around to bounce a bit. Ultimately, this is a market that will be in play as well. The recent move to the upside has formed something akin to a bullish flag. We will just have to wait and see how this plays out. The 50-day EMA is an indicator that traders have seen cause support and will capture a certain amount of attention. To the upside, we have the 1.4150 level offering a bit of resistance.
GBP/USD Technical Analysis
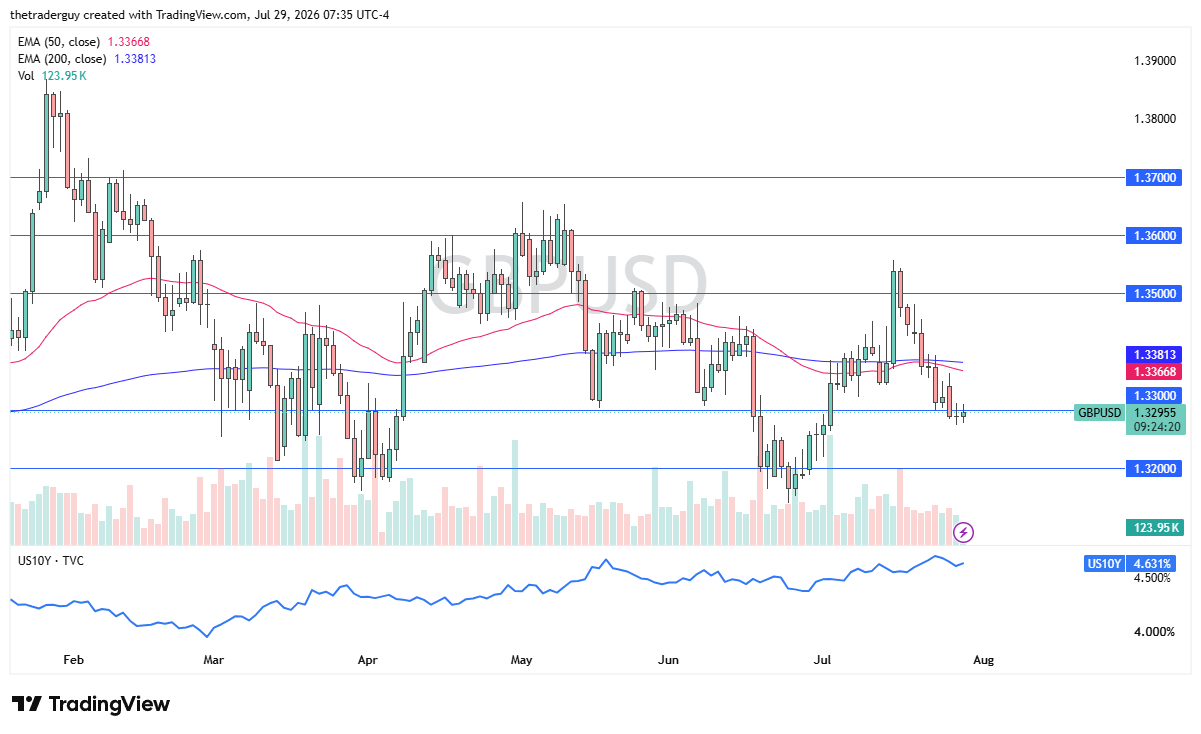
The British pound has been back and forth during the course of the trading session, with the 1.33 level offering a bit of a magnet for price. The pound rallying from here could kick off a move towards the 50-day EMA, but we will just have to wait and see whether or not that plays out. If we break down below the lows of the Tuesday session, it is possible that sellers will become a little bit aggressive, and the next support level is closer to the 1.32 level.