The FTSE 100 went back and forth during the session on Wednesday, showing signs of support at the 7225 level. A breakdown from here would of course have
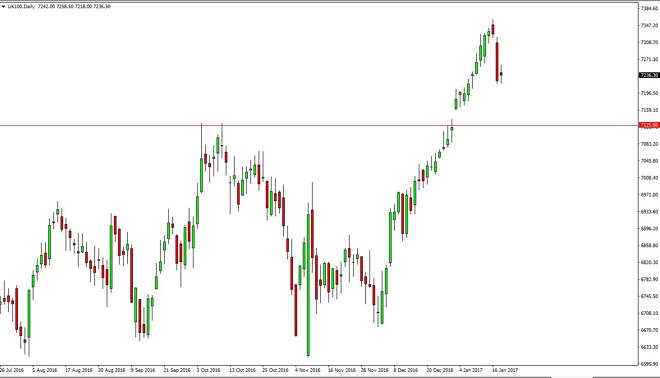
The FTSE 100 went back and forth during the session on Wednesday, showing signs of support at the 7225 level. A breakdown from here would of course have to deal with quite a bit of bullish pressure underneath, as we have seen over the past. I believe that the floor in this market is near the 7125 handle, and with that I feel it’s only a matter time before the buyers get involved. A supportive candle is reason enough to go long, just as a break above the range for the day would be.
Chris is a proprietary trader with more than 20 years of experience across various markets, including currencies, indices and commodities. As a senior analyst at FXEmpire since the website’s early days, he offers readers advanced market perspectives to navigate today’s financial landscape with confidence.