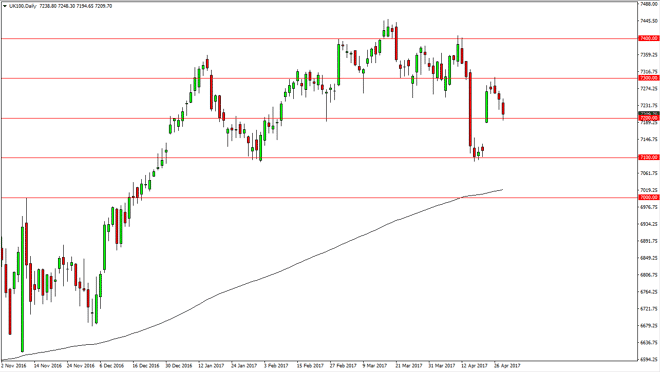
The FTSE 100 fell on Friday, testing the 7200 level for support. We bounced from there, which is a bullish sign, especially considering that there is a
The FTSE 100 fell on Friday, testing the 7200 level for support. We bounced from there, which is a bullish sign, especially considering that there is a gap just below. However, we have spent most of the week pulling back so I think we’re going to see a massive amount of volatility. I do believe that the gap will probably get filled, and therefore I would expect the market to continue to drift a little bit lower. However, I look at that as a buying opportunity, not something that I would be concerned with.
Chris is a proprietary trader with more than 20 years of experience across various markets, including currencies, indices and commodities. As a senior analyst at FXEmpire since the website’s early days, he offers readers advanced market perspectives to navigate today’s financial landscape with confidence.