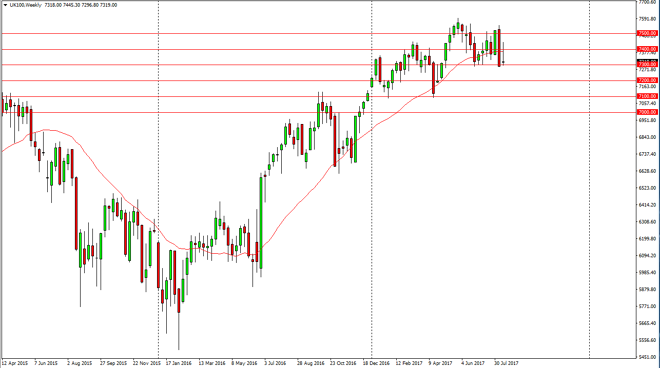
The FTSE 100 initially tried to rally during the week but found enough resistance above the 7400 level to continue to be very volatile to say the least.
The FTSE 100 initially tried to rally during the week but found enough resistance above the 7400 level to continue to be very volatile to say the least. The resulting weekly candle was a bit of a shooting star, so that’s a very negative sign. I believe that the market will eventually have to make a decision, but if we break down below the 7300 level, this market could go much lower. Alternately though, if we can break above the top of the weekly candle that is a very bullish sign and it should send this market much higher.
Chris is a proprietary trader with more than 20 years of experience across various markets, including currencies, indices and commodities. As a senior analyst at FXEmpire since the website’s early days, he offers readers advanced market perspectives to navigate today’s financial landscape with confidence.