


Early Breakout Signals Emerge
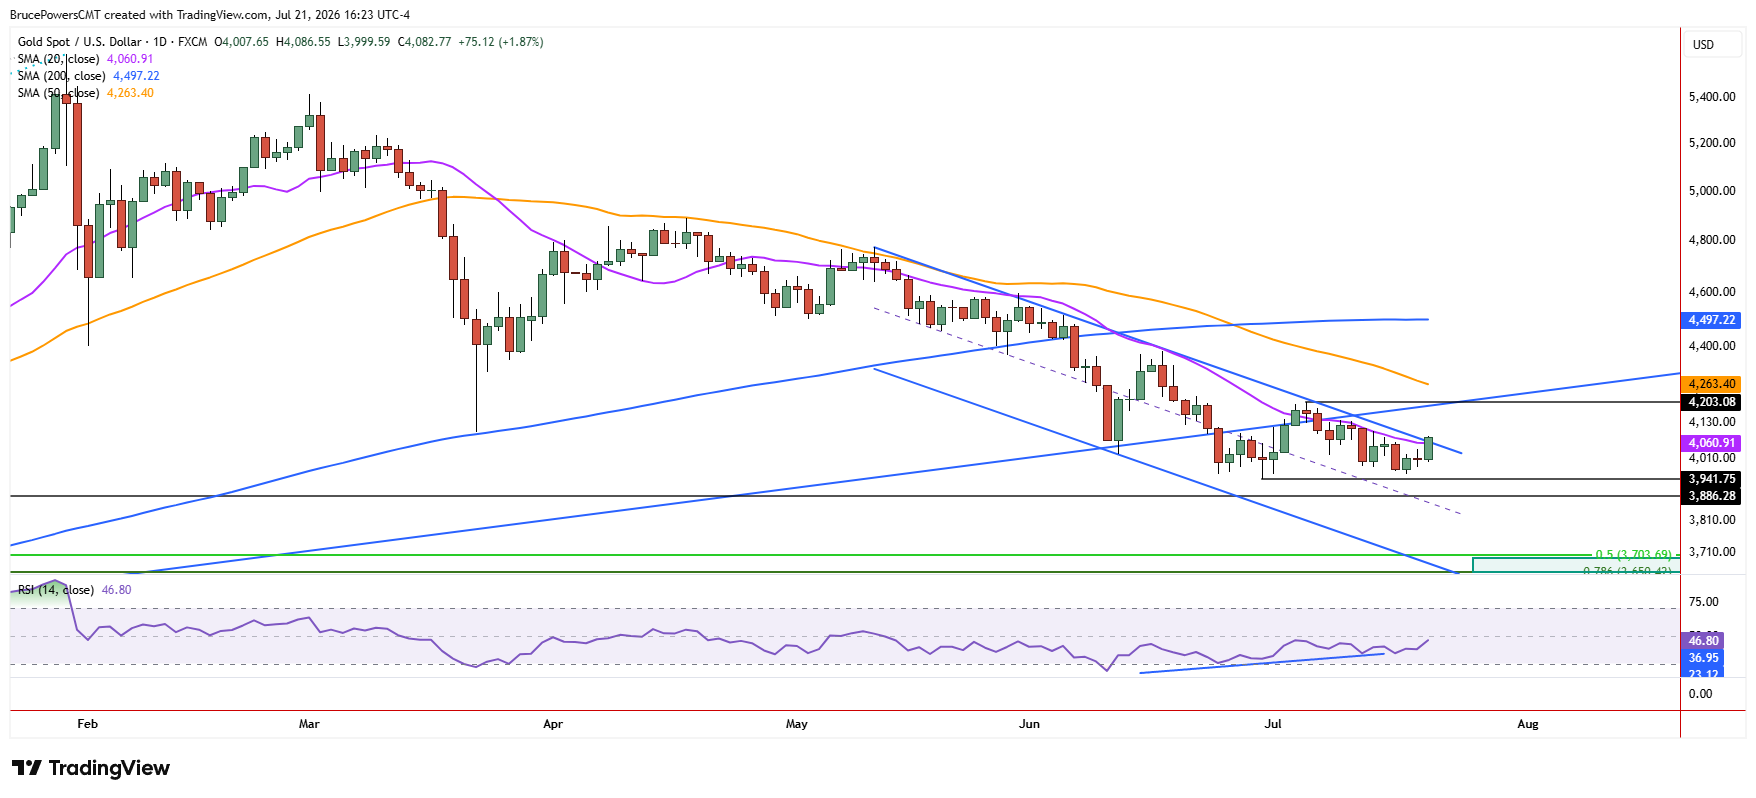
Gold broke out above the 20-day moving average at $4,060, along with the downtrend line, on Tuesday, as it reached a five-day high of $4,087. It looks likely to confirm the reclaim of the 20-day moving average with a daily close above it. Also, a daily close above $4,081 would confirm a breakout above the high of the prior four days. A higher daily low of $4,000 was established, making it short-term support. This is a bullish sign that could be the start of a bullish reversal and a rally into higher prices.
A Potential Double Bottom Takes Shape
Last week, gold established a higher swing low at $3,959, which was further confirmed on Tuesday. That set the stage for a potential double bottom bullish reversal pattern that would trigger above the neckline at the lower swing high of $4,203. Nevertheless, $4,203 is the initial upside target if strength continues from current levels.
Resistance Builds Beyond the Breakout
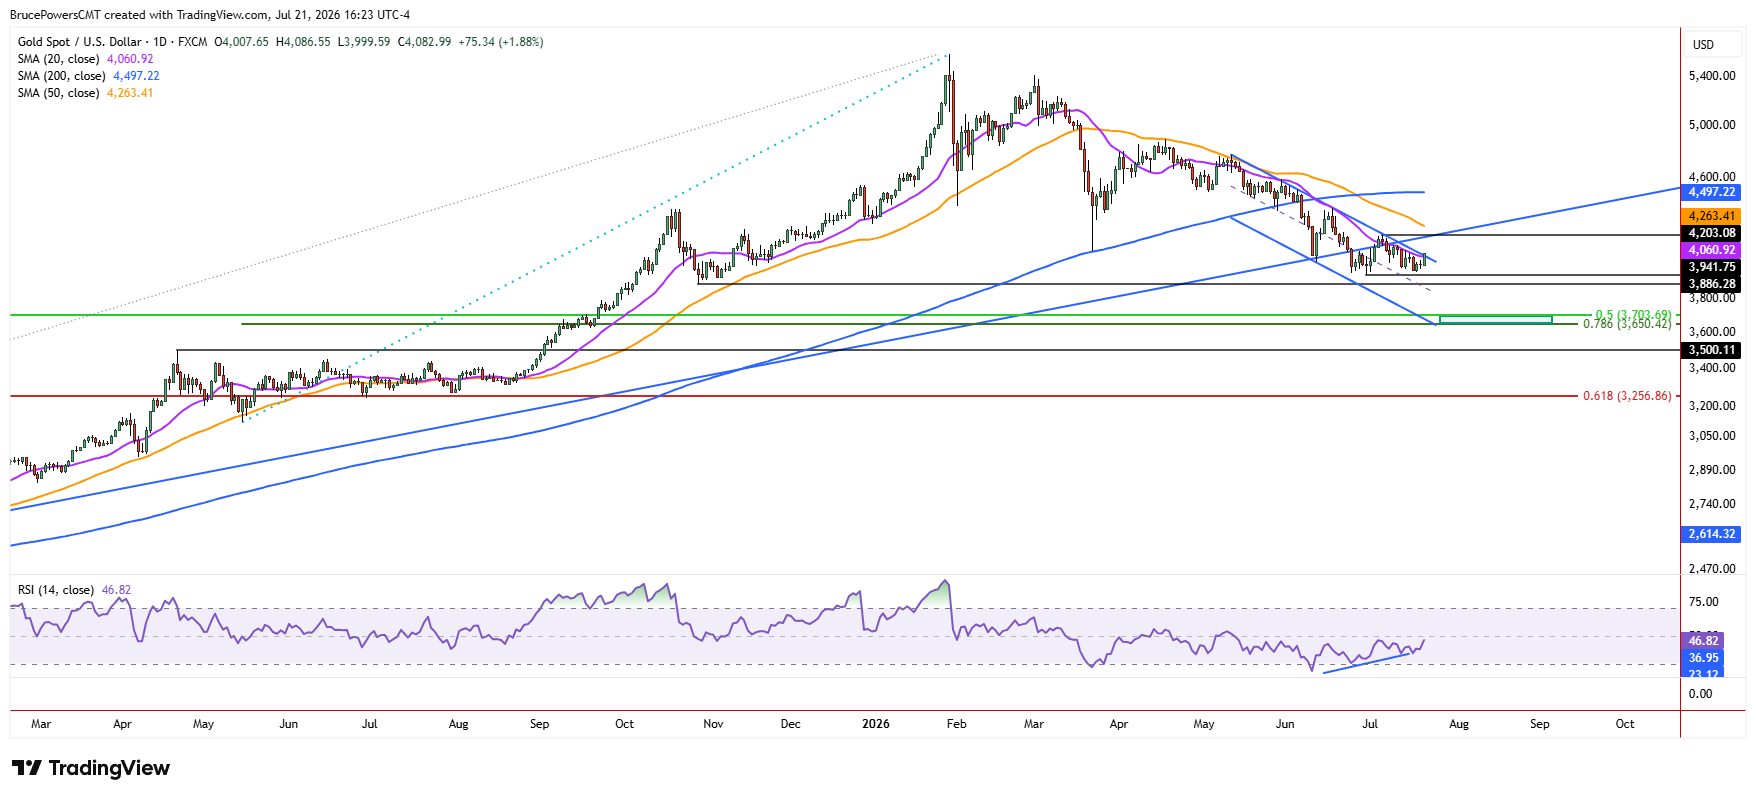
Despite the potential for upside, gold faces potentially strong resistance near the $4,203 swing high or before then. There is a long-term rising trendline that represents potential resistance nearby that level, depending on when the level is reached.
Beginning on Wednesday’s session, it looks like the first target at $4,203 could be reached without price recovering the trendline. That adds to the potential significance of resistance near this price zone. Moreover, another dynamic upside target is represented by the falling 50-day moving average, now at $4,263. It may be near the $4,203 level and the trendline by the time price reaches that area. Since the 50-day moving average presents an upside target once gold reclaims the 20-day moving average, it will soon need to be considered along with the lower swing high and trendline price zone, reinforcing the significance of the resistance zone.
The Next Test Could Define the Reversal
The good news for the bulls is that, with a more significant resistance zone, an upside breakout could result in a more powerful reaction than otherwise. A recovery of both the 200-day and 50-day moving averages would show the beginning of a recovery that would be in its early stages. Therefore, the recent breakout above the 20-day moving average and downtrend line is an important first step, but the reaction around $4,203 will determine whether gold can turn that early strength into a more meaningful reversal.
Gold Price Forecast
Every new Gold analysis as it publishes, today's technical signal and key levels, live price — on one page.
See all Gold forecastsIf you’d like to know more about how to trade gold and silver, please visit our educational area.