


Long-Term Support Sparks Early Reversal Signals
Shares of Oracle Corporation (ORCL), a leading enterprise software and cloud computing firm, reached a corrective low of $120.03 on Monday, as it tested a long-term support zone from April 2025 at $118.86. That test was successful so far, and it resulted in signs of strength on Tuesday, with a one-day bullish reversal signal triggering. ORCL is showing oversold conditions, with the Relative Strength Index (RSI) momentum oscillator below 30 for much of July.
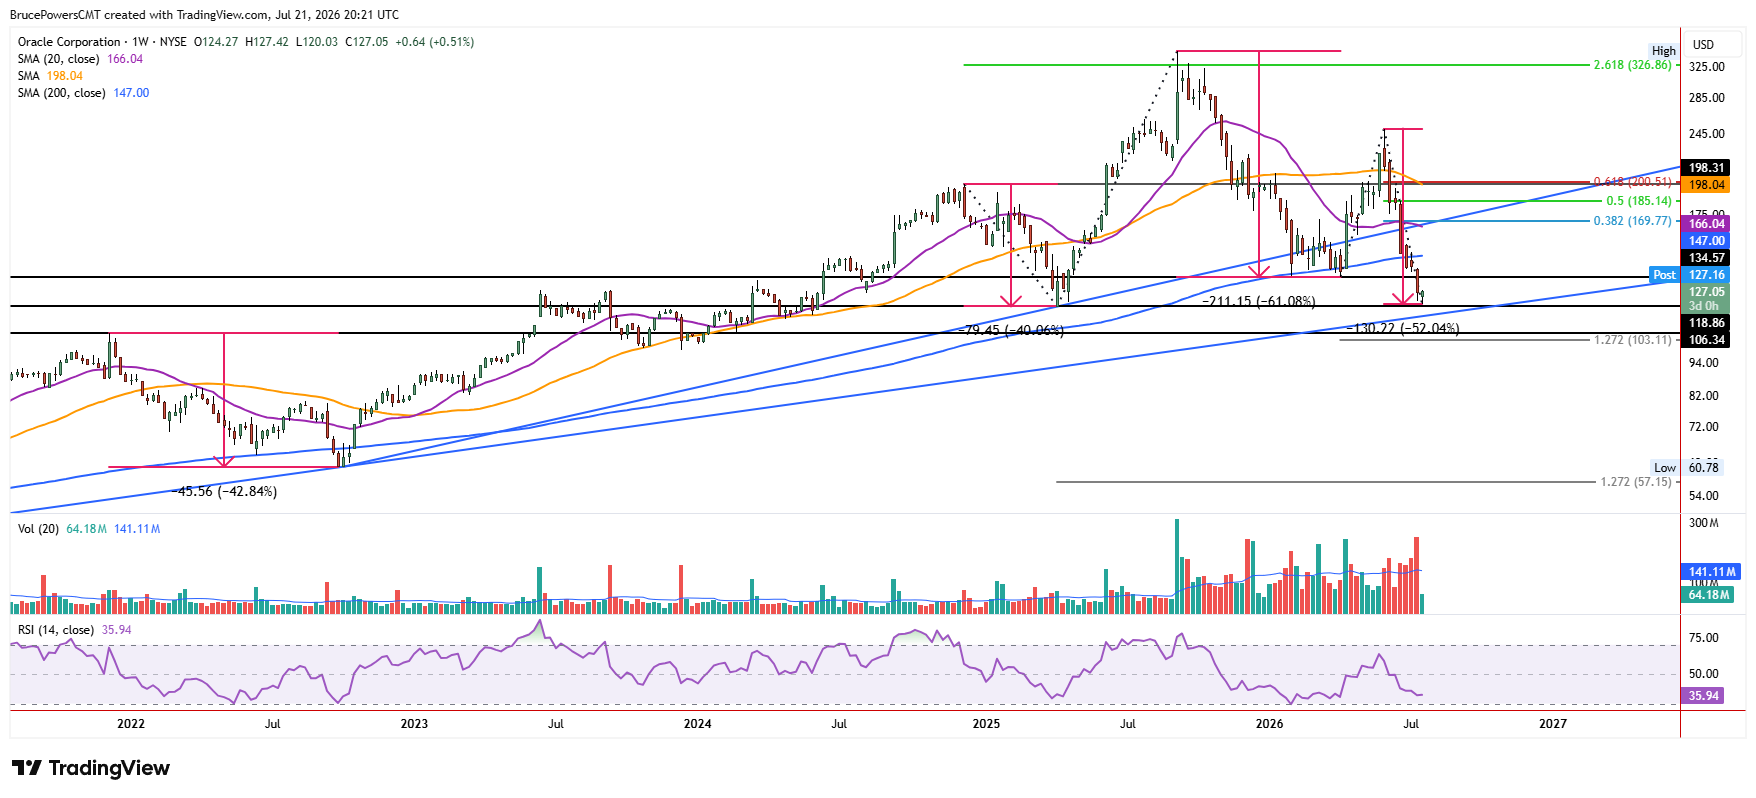
A Deep Decline Leaves ORCL Oversold
ORCL faces a key test of support after falling as much as 52% from the recent lower swing high at $250.25, and around 65.3% from its peak of $345.72 from September 2025. These are larger declines than those seen in earlier bearish corrections since the 2002 bottom and speak to underlying selling pressure within the larger bullish trend. The magnitude of the decline also supports the perception of ORCL being very oversold and, therefore, overdue for a counter-trend rally.
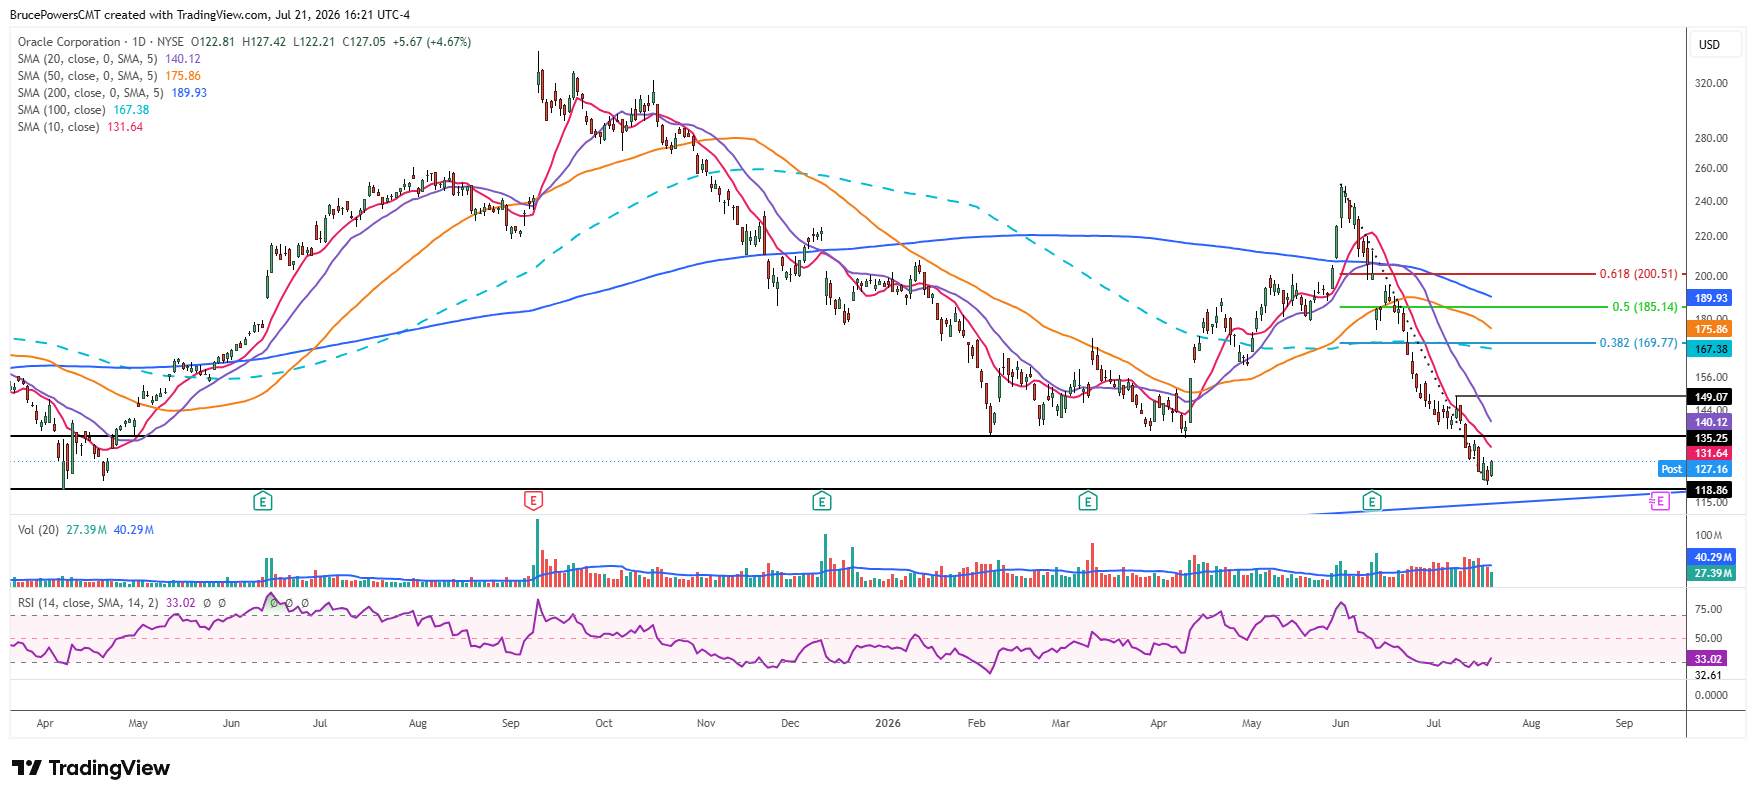
Could a Capitulation Low Attract Buyers?
If the bearish correction extends below the April 2025 low of $118.86, it could move toward a long-term uptrend line that is a little lower. If reached today it would be near $114.82. That would produce an undercut of the April 2025 swing low, flushing out stops on long positions and possibly creating an opening to attract buyers.
Such a move could create a potential capitulation low, particularly if price quickly recovers back above the $118.86 support level. Since there is the potential for a decline to the trendline and therefore an undercut of a key support level, that could create the environment to attract buyers. However, this scenario is not needed for a rally to unfold before a new corrective low is established.
Successive Resistance Levels Hold the Key
Initial upside resistance is near the falling 10-day moving average at $131.64. If that near-term dynamic resistance zone can be reclaimed, then ORCL may trigger a minor bullish reversal of structure before the lower swing high of $133.90. That level is closely followed by potential resistance near the 20-day moving average, now near $140.13 and falling.
A daily close above that average is needed to signal that an upside recovery may continue. However, a bullish reversal signal above the lower swing high of $149.07 will provide a more definitive bullish reversal for the declining structure. Therefore, while the successful test of long-term support near $118.86 offers an early reason for bulls to remain alert, ORCL still needs to reclaim successive resistance levels to confirm that a more durable recovery is underway.