


Rally Presses into Resistance
Buyers remained in control of WTI crude oil on Tuesday, as it established a new high for the current advance at $85.84 and a higher daily low of $82.18. At the time of writing, crude oil was trading near the highs of the day. A daily close above the prior trend high at $85.45 from Monday would confirm a bullish trend extension and signal that the advance remains intact.
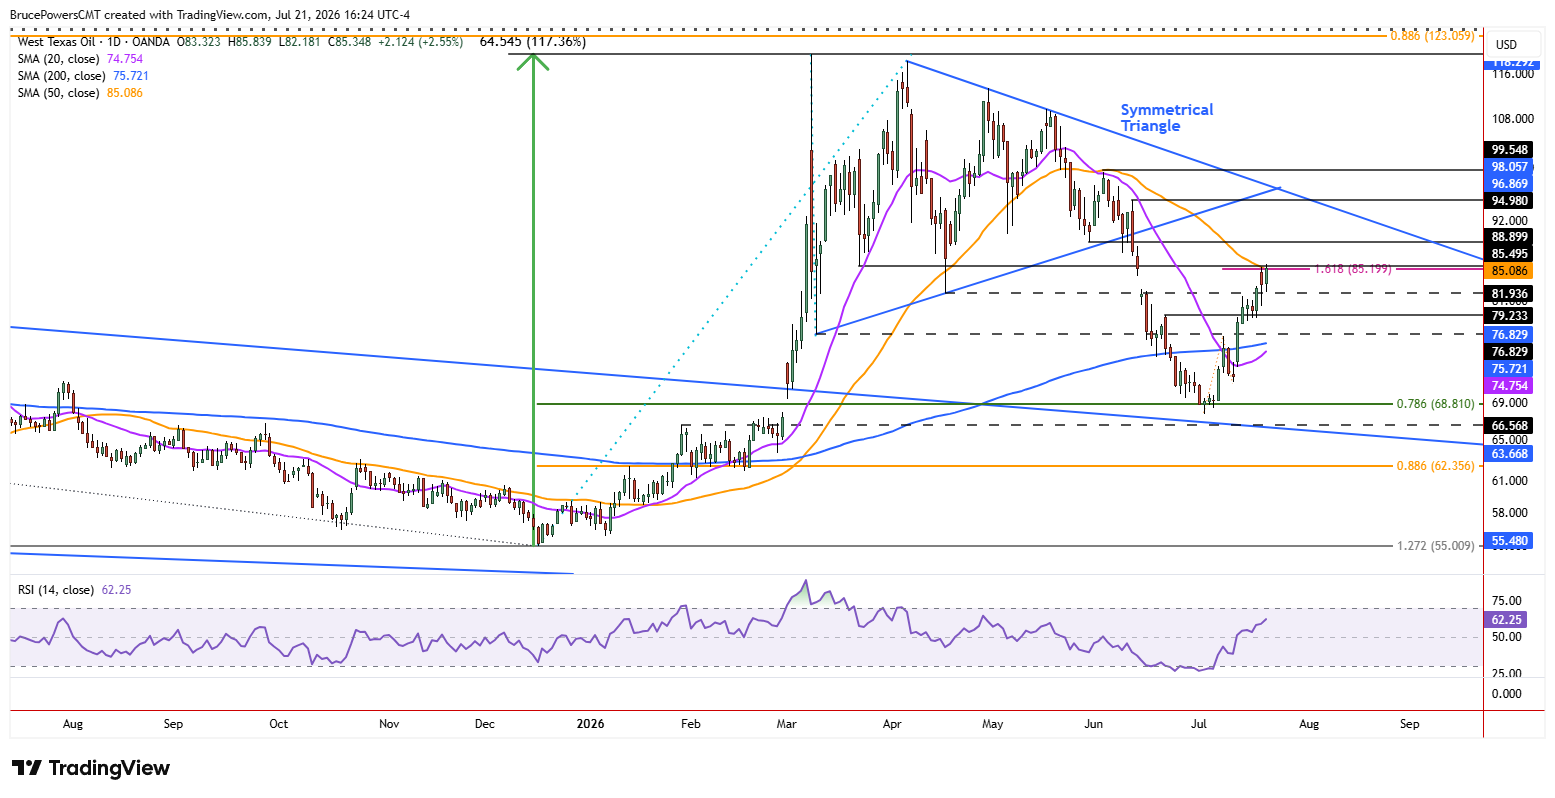
Tuesday’s bullish action demonstrated continued strength, as an initial key upside target zone was tested for signs of resistance. The zone is defined by a price cluster anchored by the 50-day moving average, now near $85.09, and reinforced by a 161.8% Fibonacci projection for a rising ABCD pattern that began from the July 2 corrective bottom at $67.73, along with an interim swing low from March near $85.50.
A Healthy Rally Meets a Familiar Test
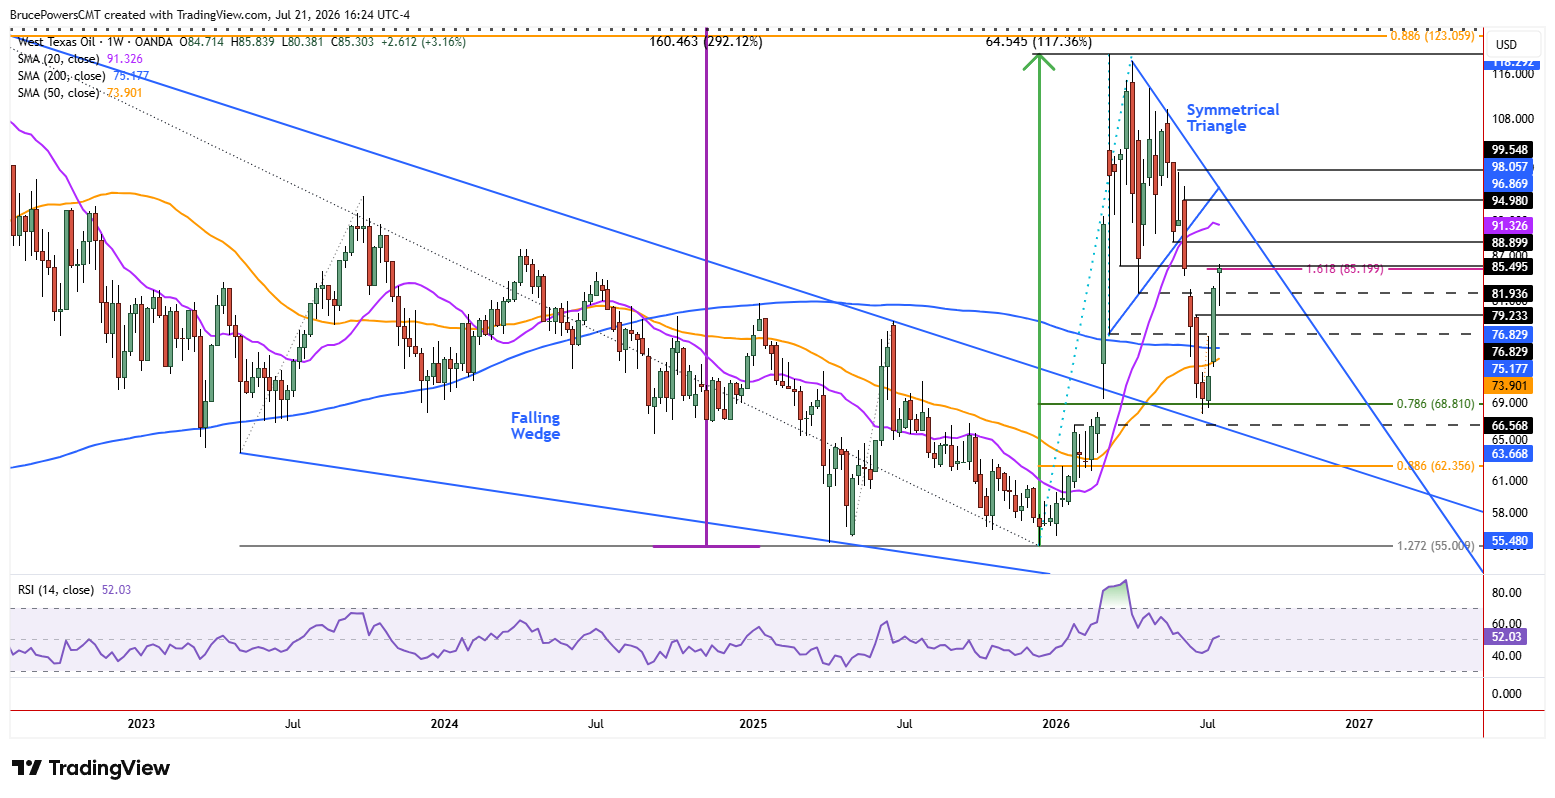
This is the second approach to the 50-day average and a test of it as resistance since it was broken to the downside in late May. With the market recognizing this resistance zone, as reflected by both Monday and Tuesday’s daily highs, there is a reasonable chance that a pullback could follow. As of Tuesday’s high, crude oil prices were higher by 26.7%. That represents a relatively healthy advance in only 13 trading days, increasing the potential for at least a near-term pause or pullback.
Support Defines the Pullback Risk
If a decline follows Tuesday’s high, potential support zones include a prior lower swing high from the previous downtrend at $79.23, a higher swing low from the current advance at $76.61, and the 200-day moving average, currently near $75.72. A successful test of support near the 200-day moving average would further solidify the recent completion of a bearish correction to a long-term support zone.
Breakout Opens the Door to Higher Targets
Alternatively, a decisive breakout above Tuesday’s high would show continued strength and trigger a new trend continuation signal through a key resistance zone. Such a breakout would reinforce the bullish momentum and could open the way toward higher targets. The next upside targets are near an interim swing low of $88.90, followed by a lower swing high at $94.98. Therefore, the key near-term question is whether crude oil can break decisively above the $85.84 high or instead pull back to test support after its sharp 13-day advance.