The British pound continues to grind sideways just above the 200-day exponential moving average and the previous resistance at the 1.2750 level. However,
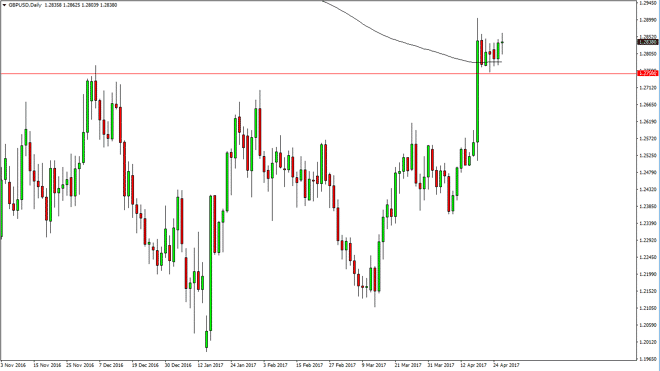
The British pound continues to grind sideways just above the 200-day exponential moving average and the previous resistance at the 1.2750 level. However, this candle looks a little bit more bullish than the others, and therefore I think a break above the top of this candle should send this market much higher. I believe that the market will eventually find its way to the 1.3450 level above, and the dips should continue to be well supported. I have no interest in shorting, I believe that the British pound has changed its overall trend.
Chris is a proprietary trader with more than 20 years of experience across various markets, including currencies, indices and commodities. As a senior analyst at FXEmpire since the website’s early days, he offers readers advanced market perspectives to navigate today’s financial landscape with confidence.