The British pound initially rally against the US dollar on Friday, but then pulled back into continue to try to build a bit of a base in this general
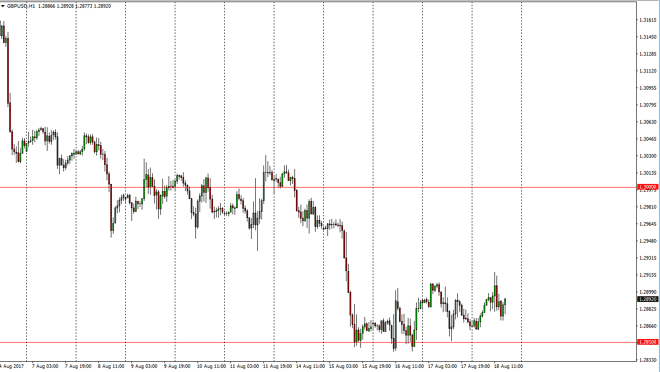
The British pound initially rally against the US dollar on Friday, but then pulled back into continue to try to build a bit of a base in this general vicinity. I think that we will probably see this market rally from here, but I think is a short-term trade. I suspect that the 1.30 level above will cause quite a bit of resistance, and is not until we break above the 1.3050 level that I would feel comfortable holding onto a trade to the upside. I suspect short-term traders will get involved, but eventually find sellers up near the 1.2950 level or so to start selling again.
Alternately, if we break down below the 1.28 level, the market will start to sell off rather drastically. I think at that point, we may be looking for a move down to the 1.27 level, possibly even the 1.25 level after that. In the meantime, I would expect a lot of choppiness and therefore I haven’t been trading this pair that much lately.
Chris is a proprietary trader with more than 20 years of experience across various markets, including currencies, indices and commodities. As a senior analyst at FXEmpire since the website’s early days, he offers readers advanced market perspectives to navigate today’s financial landscape with confidence.