The GBP/USD pair initially fell on Monday but found enough support near the 1.24 level to turn things around and form a hammer. That of course is a
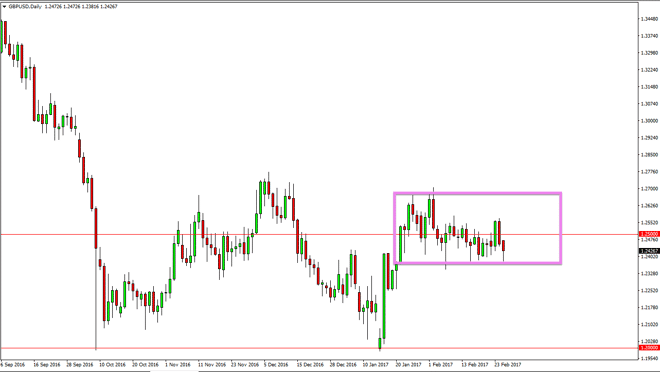
The GBP/USD pair initially fell on Monday but found enough support near the 1.24 level to turn things around and form a hammer. That of course is a bullish sign in the fact that we been consolidating for some time suggests to me that the buyers are about to jump back into this market and push. I think the 1.27 level will continue to be resistive, so I do not expect a move above there. Short-term buying opportunities continue to present themselves for those of you who are patient, and this seems to be yet again another example of that.
Chris is a proprietary trader with more than 20 years of experience across various markets, including currencies, indices and commodities. As a senior analyst at FXEmpire since the website’s early days, he offers readers advanced market perspectives to navigate today’s financial landscape with confidence.