The GBP/USD pair went back and forth, forming a relatively neutral candle. There is a significant amount of support below though, as the 1.20 level
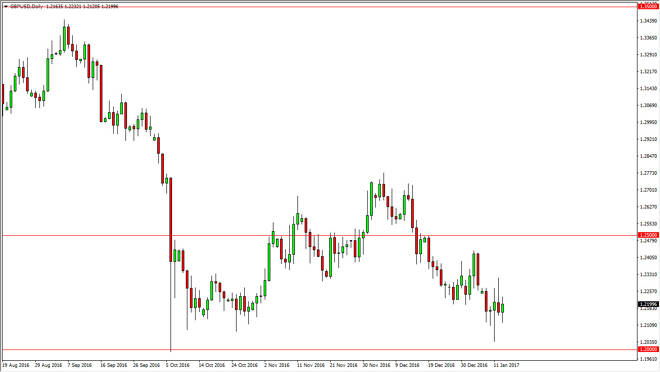
The GBP/USD pair went back and forth, forming a relatively neutral candle. There is a significant amount of support below though, as the 1.20 level underneath offers a major barrier. A break above the top of the shooting star from the Thursday candle tells me that the market wants to go to the 1.25 level above, which is massively resistive. Ultimately, there is a longer-term weekly hammer, so that suggests to me that the buyers are trying to build a bit of a floor in this area. Regardless of what’s happening, I expect a lot of volatility.
Chris is a proprietary trader with more than 20 years of experience across various markets, including currencies, indices and commodities. As a senior analyst at FXEmpire since the website’s early days, he offers readers advanced market perspectives to navigate today’s financial landscape with confidence.