The British pound initially went sideways during the session on Wednesday, but then collapsed below the 1.3250 level. This is an interesting move, because
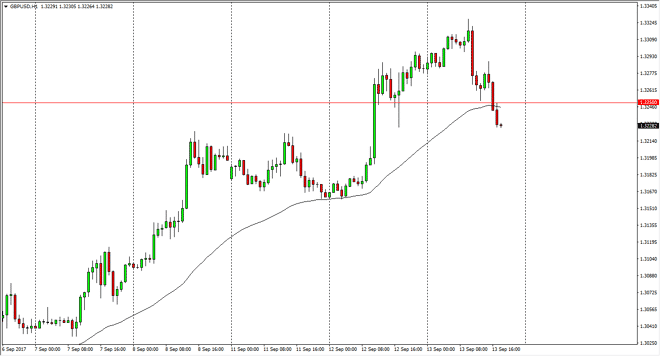
The British pound initially went sideways during the session on Wednesday, but then collapsed below the 1.3250 level. This is an interesting move, because breaking above that level was important. The question now is whether we can continue to go higher? A lot of the negative pressure will be due to headlines crossing the wires that the US may be closer to tax reform than anticipated, and that of course helps the US dollar. Ultimately though, the interest rate meeting coming in London today will have more of an effect, especially with the monetary policy meeting minutes coming out. At this point, it appears that the market is trying to find a bit of support, and a break above the 1.3275 level signals that perhaps the buyers are coming back.
Chris is a proprietary trader with more than 20 years of experience across various markets, including currencies, indices and commodities. As a senior analyst at FXEmpire since the website’s early days, he offers readers advanced market perspectives to navigate today’s financial landscape with confidence.