
Advertisement
Advertisement
GBP/USD forecast for the week of January 16, 2017, Technical Analysis
Updated: Jan 16, 2017, 07:00 GMT+00:00
During the past week, the British pound initially started off by a selling off drastically. We reach towards the 1.20 level, which has been massive
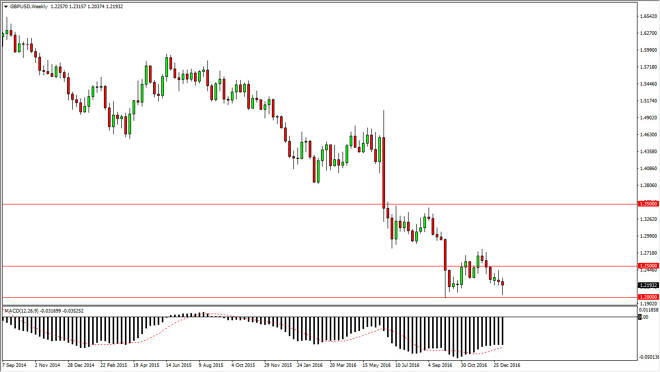
During the past week, the British pound initially started off by a selling off drastically. We reach towards the 1.20 level, which has been massive support as of late, and then bounced enough to form a hammer. The hammer is a very bullish sign, and thus I suspect that the buyers are going to be getting involved. However, this is going to be a very choppy market going forward, as we could be looking at a potential trend change. If that’s the case, expect a lot of volatility and don’t get involved unless of course you can deal with quite a bit of volatility. A break above the top of the hammer is a sign that the buyers are getting involved, and a break above the 1.2750 level sends this market much higher. The 1.20 level is a major level in this pair, so if we break down below their things change drastically.
However, I believe that the British pound selling off is only going to be a temporary thing. When I look at a multi-year chart, there is a massive floor at the 1.15 handle as well as the 1.20 level, so I think it’s only a matter of time before value investors get involved. The Federal Reserve is looking to raise interest rates true enough, but the question remains whether they can. Trend changes are very volatile and nasty looking things, and that’s probably which are going to see in this pair. There was a point where the swap alone would be reason enough to hang onto this type of trade but unfortunately most retail shops are going to pay you either know swap, or a slightly negative one.
However, I think if you are a longer-term player you can take a shot on the street, but you must be able to deal with a significant drop if we do break down below the 1.20 level. This is a multitier trade waiting to happen, but I don’t know quite yet if were ready. There are a couple signs on this chart though, one of which is the MACD picking up some positivity at the same time we have formed what could be a “double bottom.” I’m keeping my eyes open, and putting a small long position on.
Watch our GBP/USD Video Forecast:
About the Author
Christopher Lewisauthor
Chris is a proprietary trader with more than 20 years of experience across various markets, including currencies, indices and commodities. As a senior analyst at FXEmpire since the website’s early days, he offers readers advanced market perspectives to navigate today’s financial landscape with confidence.


Advertisement