Gold (XAU) price bounced on Thursday due to the weakness of the US dollar and the US Treasury yields. The spot gold price hit the $4,125 while the spot silver (XAG) price hit $60. The drop in oil prices helped ease inflation fears and reduce the pressure on the bond market.
Oil prices also dropped due to the easing of tensions between the US and Iran. This reduced the prospects for immediate inflationary pressures from energy. But the Fed remains concerned about high inflation, which edged up to 4.2% in May. The markets are now expecting a potential rate hike in September. Higher interest rates could also limit the recovery in gold and silver.
Silver prices also gained momentum on a softer US dollar and Treasury yields. The metal tends to move in tandem with gold when it makes significant moves in the precious metals market. Silver is also linked with industrial demand, so it could be more sensitive to economic growth.

Gold Price Forecast: XAUUSD Rebound Eyes $4,500 and $5,000
XAUUSD Daily Chart Signals Rebound From Key Support
The daily chart for spot gold shows that the price is rebounding higher after consolidating above $3,950. This support area is defined by lower boundary of the wedge. The immediate resistance remains the $4,280 area. A break above $4,280 will push prices towards $4,350.
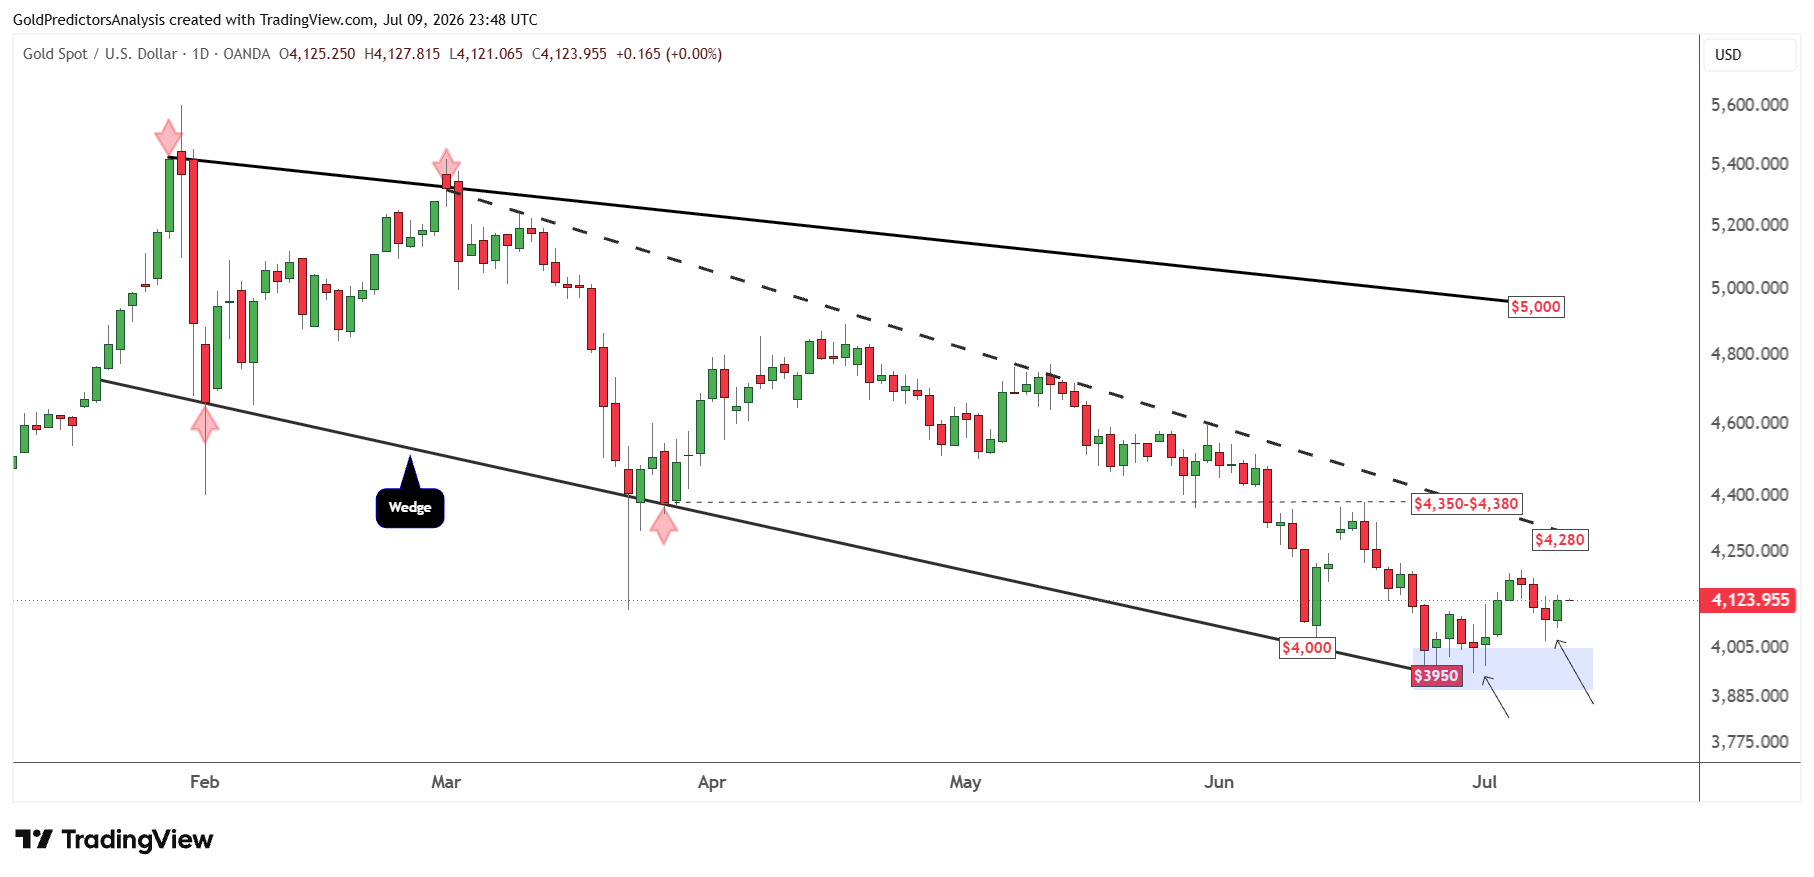
However, a break above $4,350 will confirm the bottom and push the price further towards $4,500. This move will open the door for a rally towards $5,000.
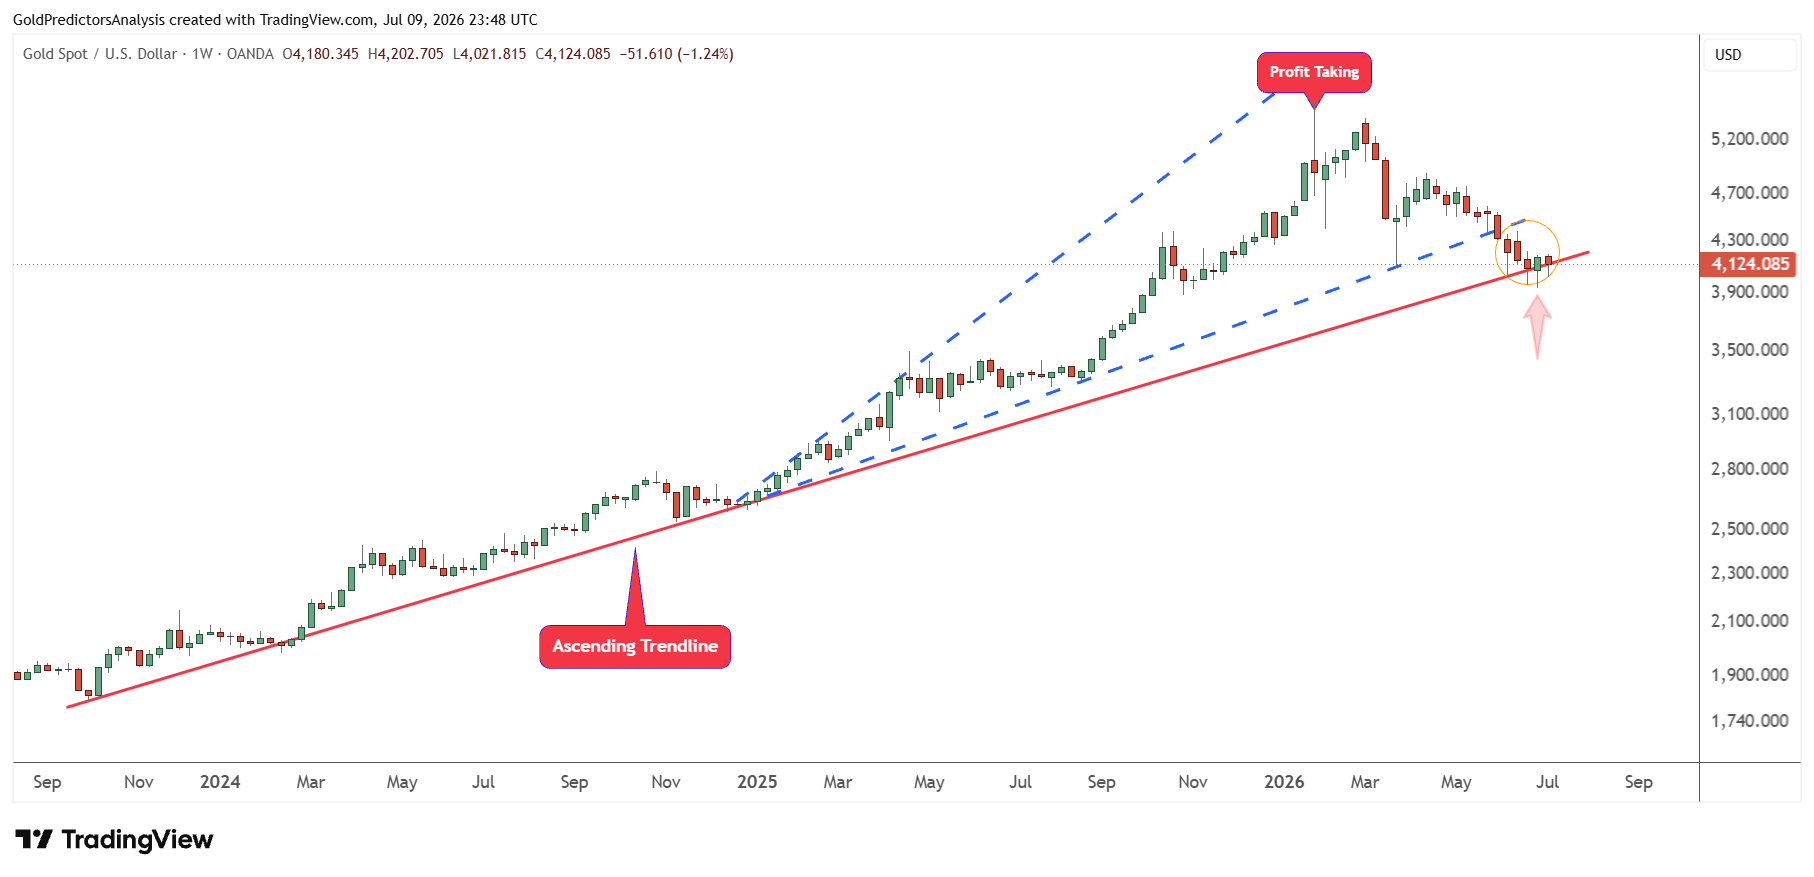
The importance of the current strong support zone is highlighted by the weekly chart. The chart shows that this support is defined by the ascending trendline that is emerging from the October 2023 lows. The emergence of a bullish hammer candle at the support line indicates that there might be a possible rebound towards the $4,500 area in the short term.
Gold Price Forecast
Every new Gold analysis as it publishes, today's technical signal and key levels, live price — on one page.
See all Gold forecastsXAUUSD 4-Hour Chart Shows Breakout Setup Toward $4,500
The 4-hour chart for spot gold also shows that the price is rebounding exactly from the support of the descending broadening wedge pattern. The price found support at the neckline of the double bottom pattern and continues to rally higher.
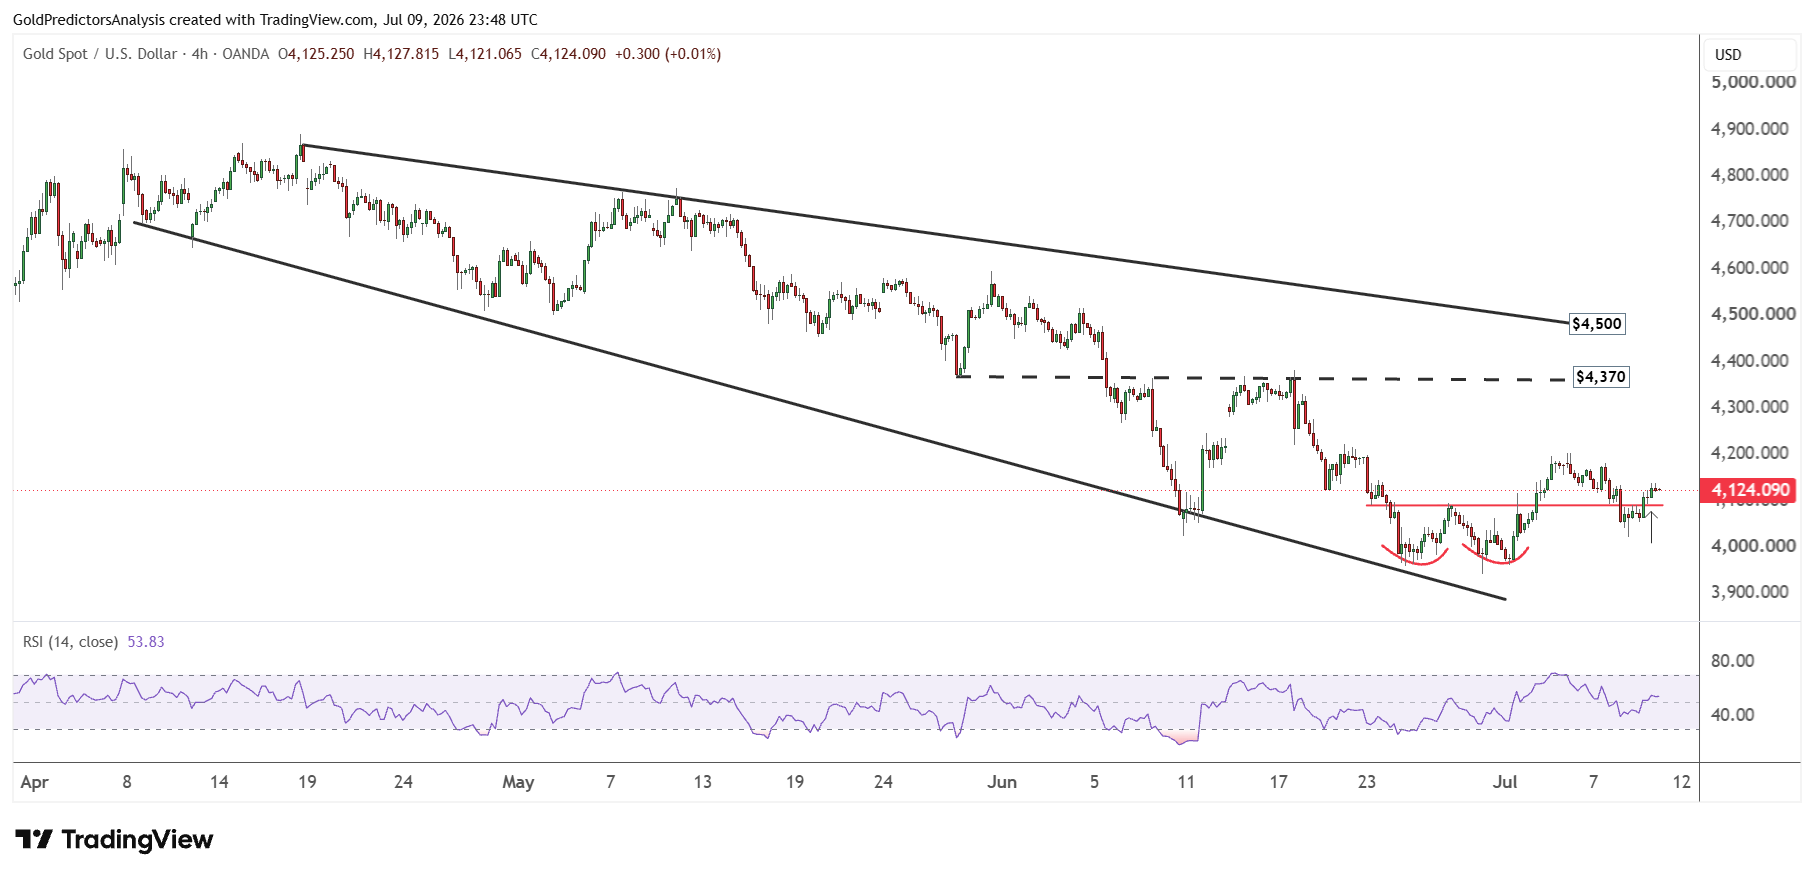
The immediate resistance remains at the $4,200 to $4,280 area. However, a break above $4,280 will push the price towards the $4,370 and $4,500 areas on 4-hour chart. The short term price action also shows that a break above $4,500 will likely open the door for a rally towards $5,000.
Silver Price Forecast: XAGUSD Breakout Eyes $72
XAGUSD Daily Chart Shows Strong Rebound From $55
The daily chart for spot silver also shows a strong rebound from $55. The price is consolidating between $55 and $64. A break of these levels will likely define the next move. Due to the importance of the $55 support zone, the price may break the $64 level and push towards $72. The $72 level is the key resistance level and a break above this level will likely open the door for a rally towards the $89 region.
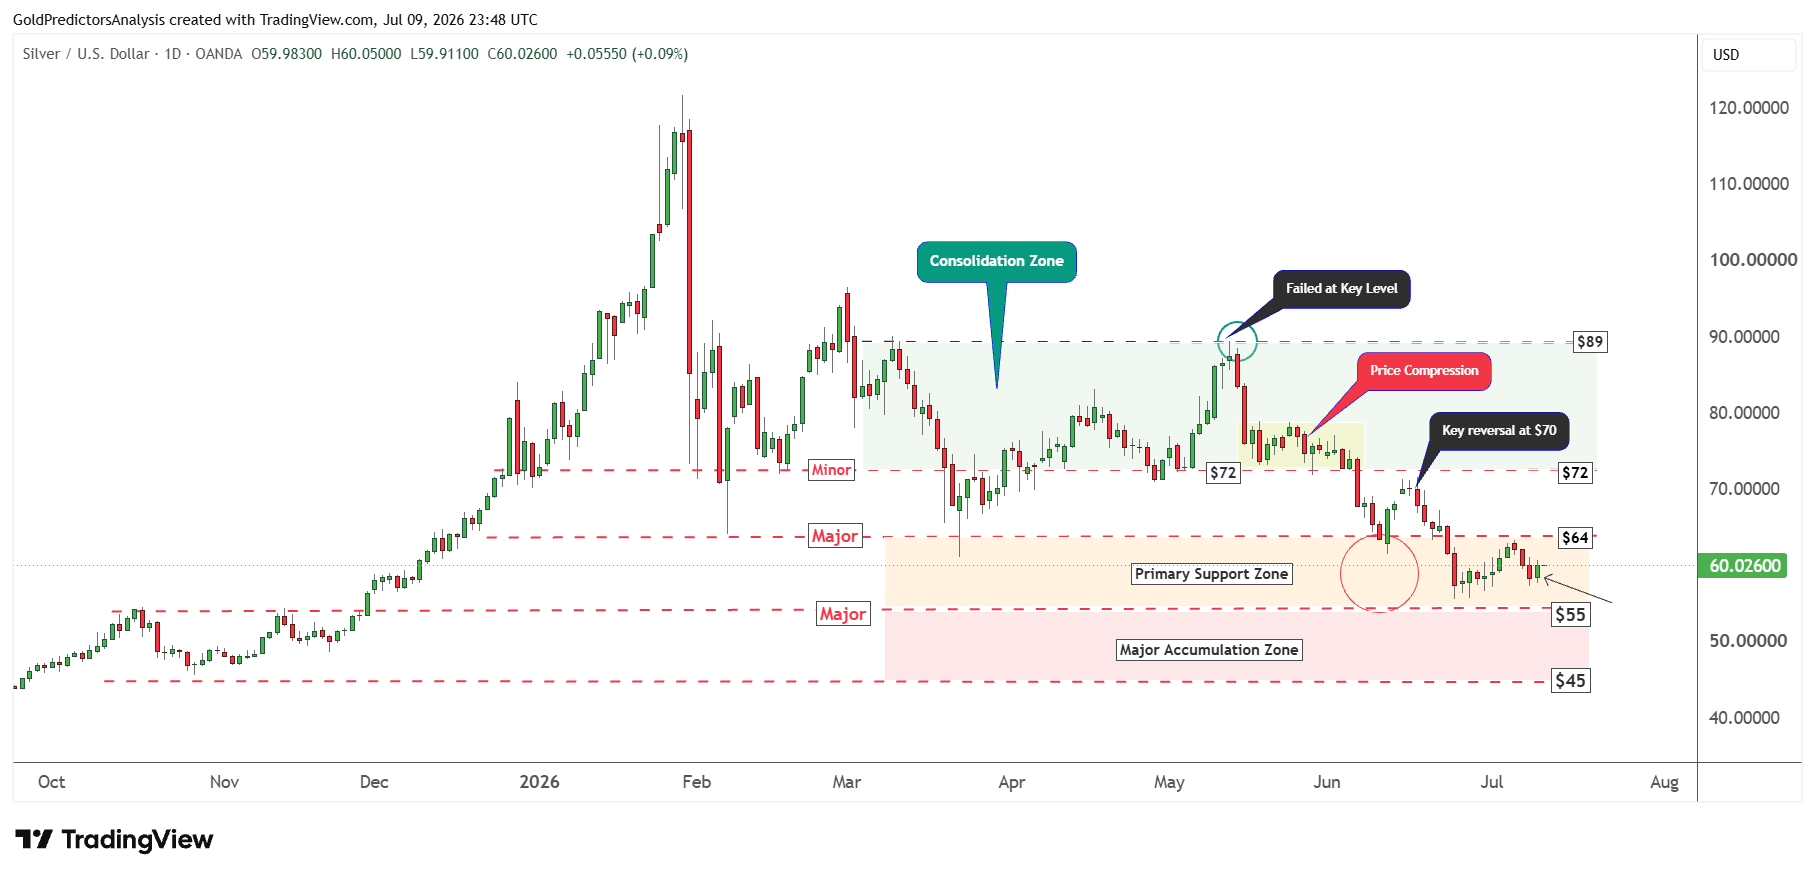
The $45 to $55 support zone remains the major accumulation zone. As long as the price remains above this zone, there is a possibility of a strong rally in silver prices in the second half of 2026.
XAGUSD 4-Hour Chart Shows Bullish Wedge Compression
The 4-hour chart for spot silver also shows price compression within the descending wedge pattern. The price is compressing between the $55 and $72 levels. A break of these levels will likely define the next short term move in silver.
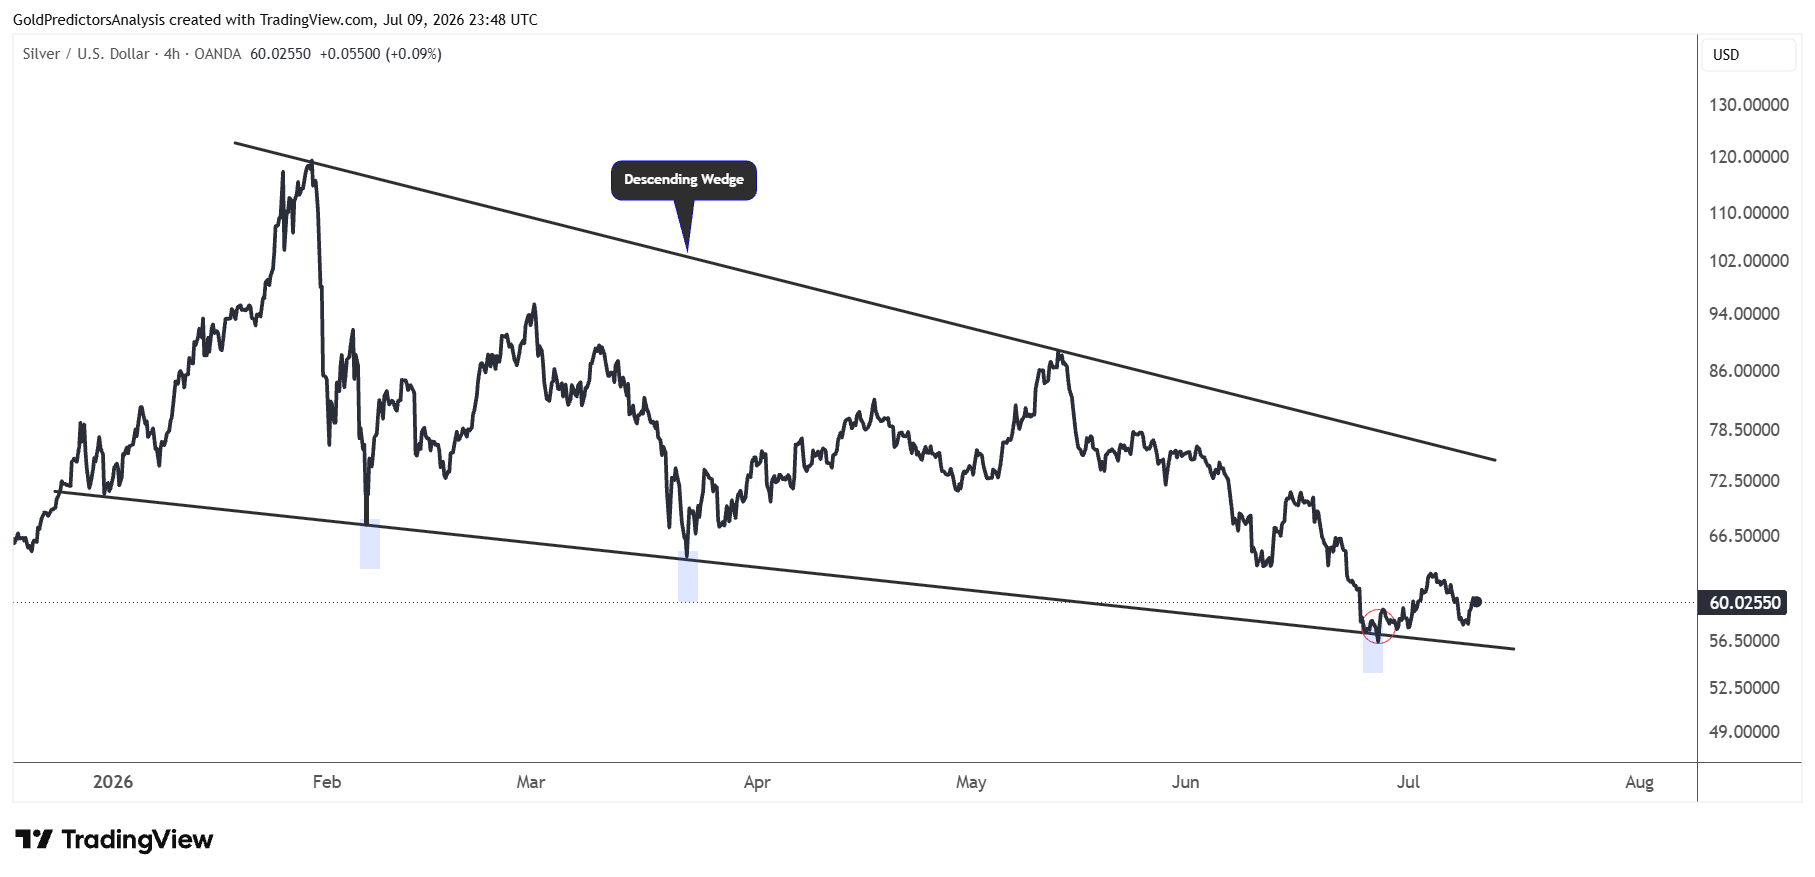
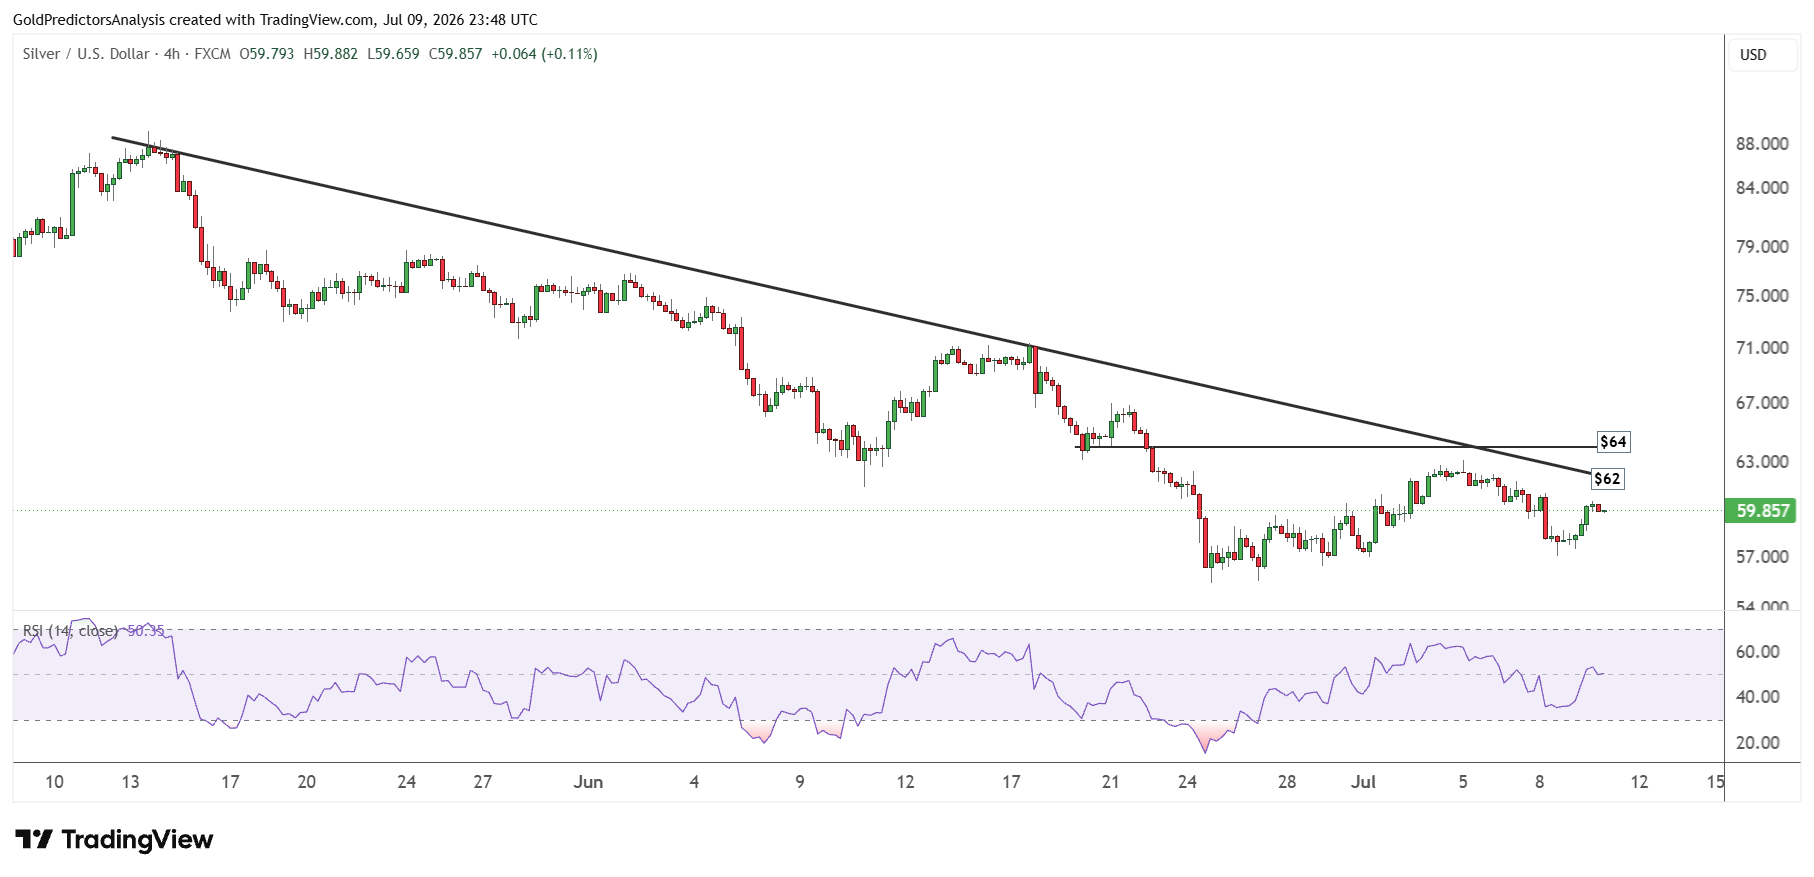
But as the price approaches the end of this wedge pattern, it is forming a bullish price action. This means that a break above $72 will likely trigger strong surge in silver prices towards $90. The short term resistance remains the $62 to $64 level as seen in the chart below.
Bottom Line
Gold and silver prices rebound from the support zones as the US dollar and Treasury yields correct. Gold price must break above $4,350 to confirm a stronger rally to $4,500 and $5,000. On the other hand, the silver price also holds the key support level of $55 and rebounds back to the resistance of $64. A break above $64 will push the price to $72. On the other hand, a break above $72 will push the price to $89. Gold and silver prices must hold the $3,950 and $55, respectively, to maintain the positive momentum.
Read more: Copper, Uranium and Lithium Test Support as Silver Nears Buy Zone