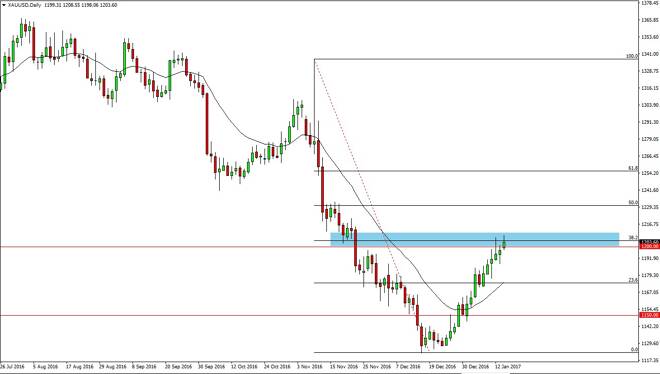
Gold markets tried to rally on Monday, but found a bit of resistance just above current levels. By doing so, it looks as if the 38.2% Fibonacci
Gold markets tried to rally on Monday, but found a bit of resistance just above current levels. By doing so, it looks as if the 38.2% Fibonacci retracement level is on the minds of traders, and we could see a return to the downtrend. A breakdown below the $1200 level should send this market lower and following the longer-term trend. Alternately, if we can break above the $1215 level it looks as if we will try to go to the $1230 level. Ultimately, I expect volatility to say the least. A strengthening US dollar could add to bearish pressure.
Chris is a proprietary trader with more than 20 years of experience across various markets, including currencies, indices and commodities. As a senior analyst at FXEmpire since the website’s early days, he offers readers advanced market perspectives to navigate today’s financial landscape with confidence.