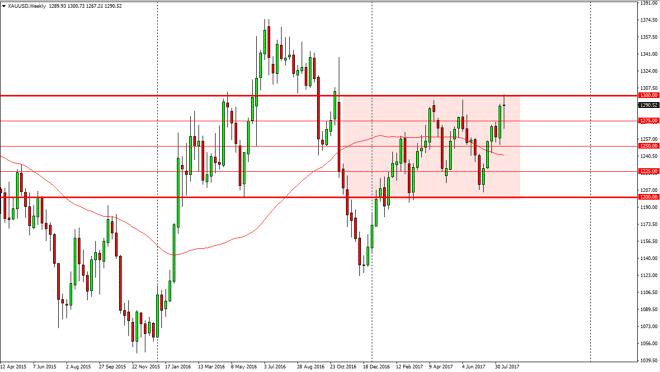
Gold markets initially fell during the week but then turned around to rally towards the $1300 level. We were rejected there, so it will be interesting to
Gold markets initially fell during the week but then turned around to rally towards the $1300 level. We were rejected there, so it will be interesting to see what happens. From a long-term trader’s standpoint, a break above the $1300 is what we need to see now. Alternately, if we break down below the bottom of the candle for the week, that would be very bearish and should send this market back into the previous consolidation area, looking for the $1200 level. Most of this has been based upon fear, so we need fear to drive gold higher.
Chris is a proprietary trader with more than 20 years of experience across various markets, including currencies, indices and commodities. As a senior analyst at FXEmpire since the website’s early days, he offers readers advanced market perspectives to navigate today’s financial landscape with confidence.