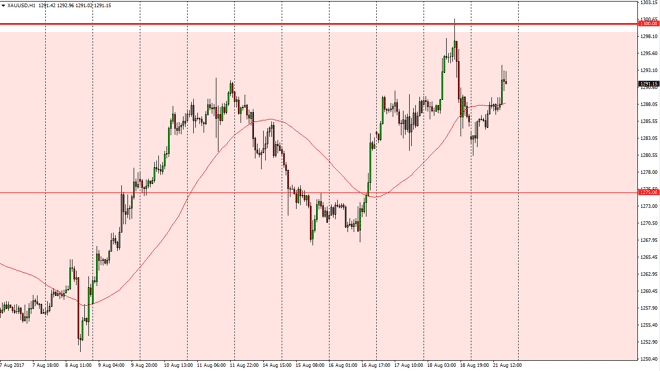
Gold markets gapped lower at the open on Monday, but then shot through that gap to reach to higher levels. We are starting to see resistance again near
Gold markets gapped lower at the open on Monday, but then shot through that gap to reach to higher levels. We are starting to see resistance again near the $1292 level, and we recently had seen the market reject the $1300 level. I don’t know if we can break above the $1300 level, but in the meantime I have to assume that the resistance returns. If we can find resistance and selling pressure, the market should continue to be consolidated of overall. Over the last several months, we have seen the $1200 level offer a bottom of the consolidation, with the $13 level above offering the top. I believe that selling once we get close to the $1300 helps, but if we break above the $1310 level, then it would be a very bullish move.
Chris is a proprietary trader with more than 20 years of experience across various markets, including currencies, indices and commodities. As a senior analyst at FXEmpire since the website’s early days, he offers readers advanced market perspectives to navigate today’s financial landscape with confidence.