Gold (XAU) rebounds from the support zone after the potential ceasefire extension between the U.S. and Iran on Thursday. The price dropped near the $4,360 level before buyers entered the market with the prospect that the conflict premium could abate. That suggests that gold is sensitive to news from the Middle East. But investors are waiting for final approval of the deal.
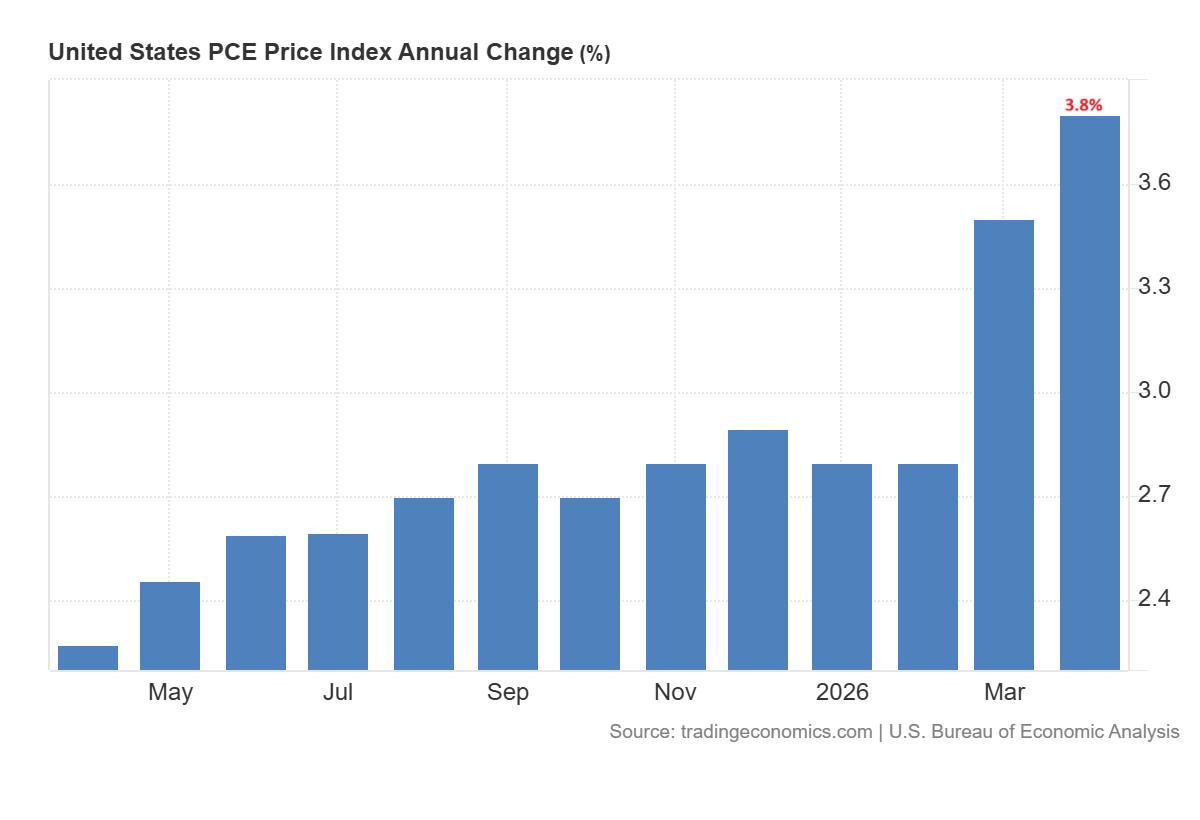
The inflation data remains the strongest signal for gold. The PCE inflation data showed the largest increase in three years. This increase is primarily due to rising energy prices caused by Iran war. This helps investors stay on the ball with sticky inflation and future Fed policy. Gold benefits from higher inflation, but when the inflation risk is compounded by higher interest rates, the opportunity cost of bullion could be a headwind.
For now, gold is caught between two forces. Ceasefire hopes have lowered the near term demand for safe havens. But inflation worries remain to support the overall bull market argument. If there is a confirmed U.S.-Iran deal, that could keep volatility high in gold and silver (XAG) prices. But any delay in the deal or further military activity may introduce additional uncertainty in precious metals.

Gold Price Forecast: Positive Structure at $4,360
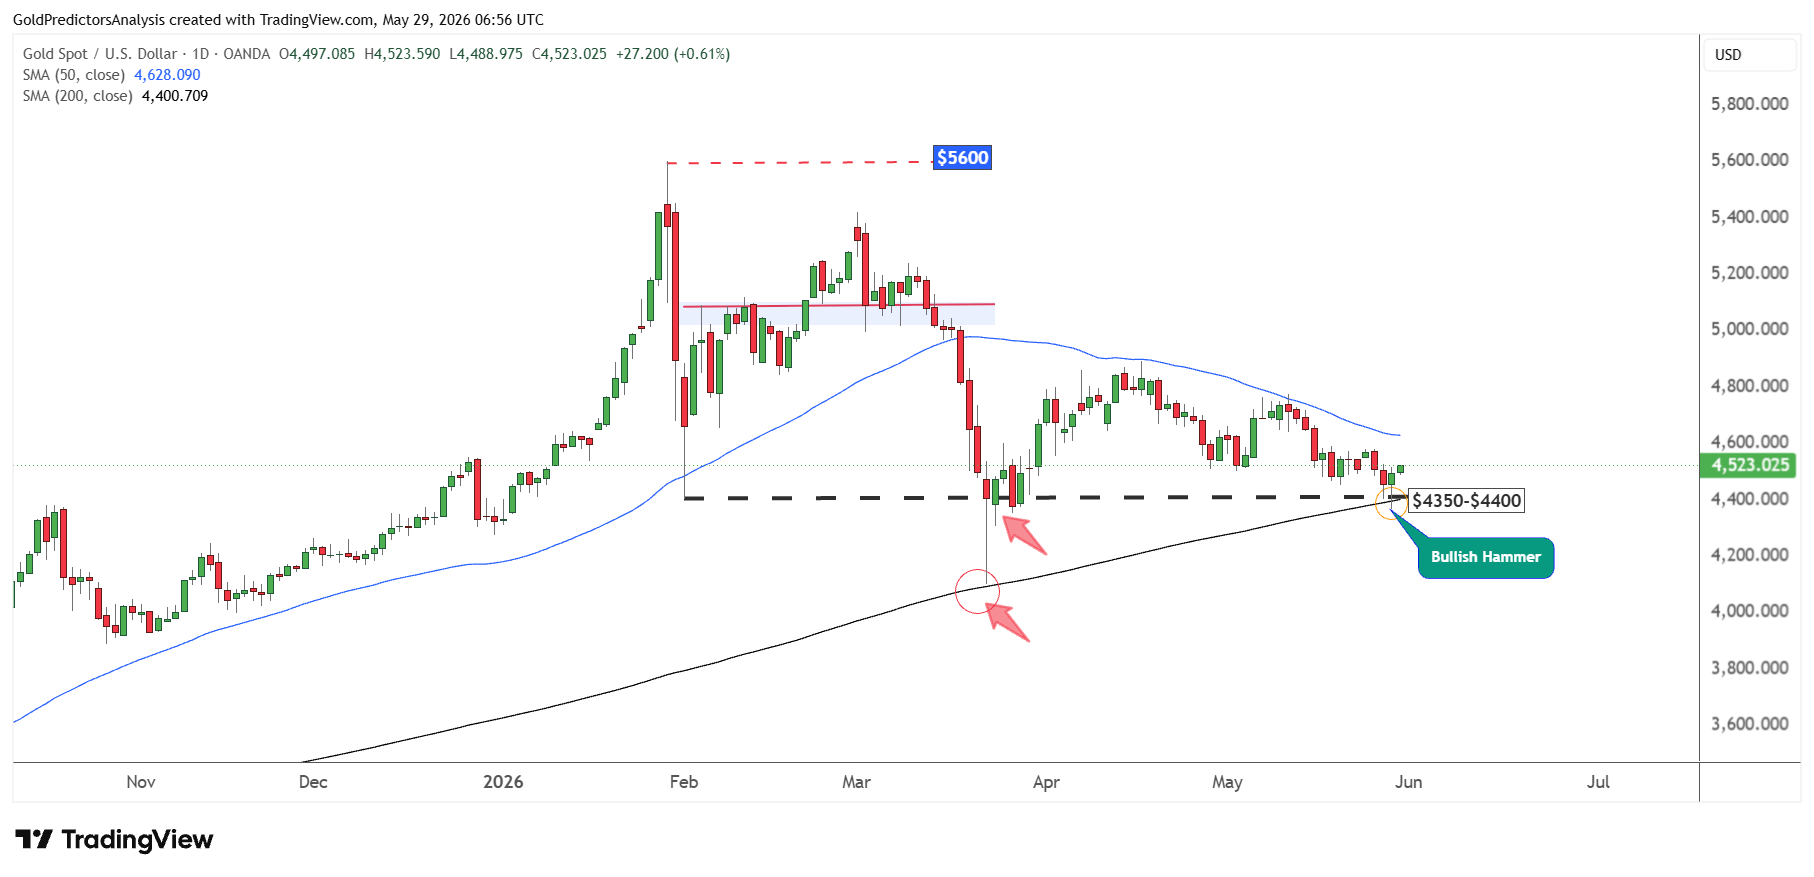
The daily chart for spot gold shows that the price rebounded from the $4,360 support level after the PCE inflation data report. This support was important due to the intersection of the 200-day SMA and the black dotted trend line, as discussed in the previous article.
This rebound may push prices toward $4,630. This is the important resistance seen by the 50-day SMA. The price still remains between the 50-day and 200-day SMAs and look for a breakout of these levels to find the next move. A break below $4,360 this time will indicate a strong drop toward the $4,000 level.
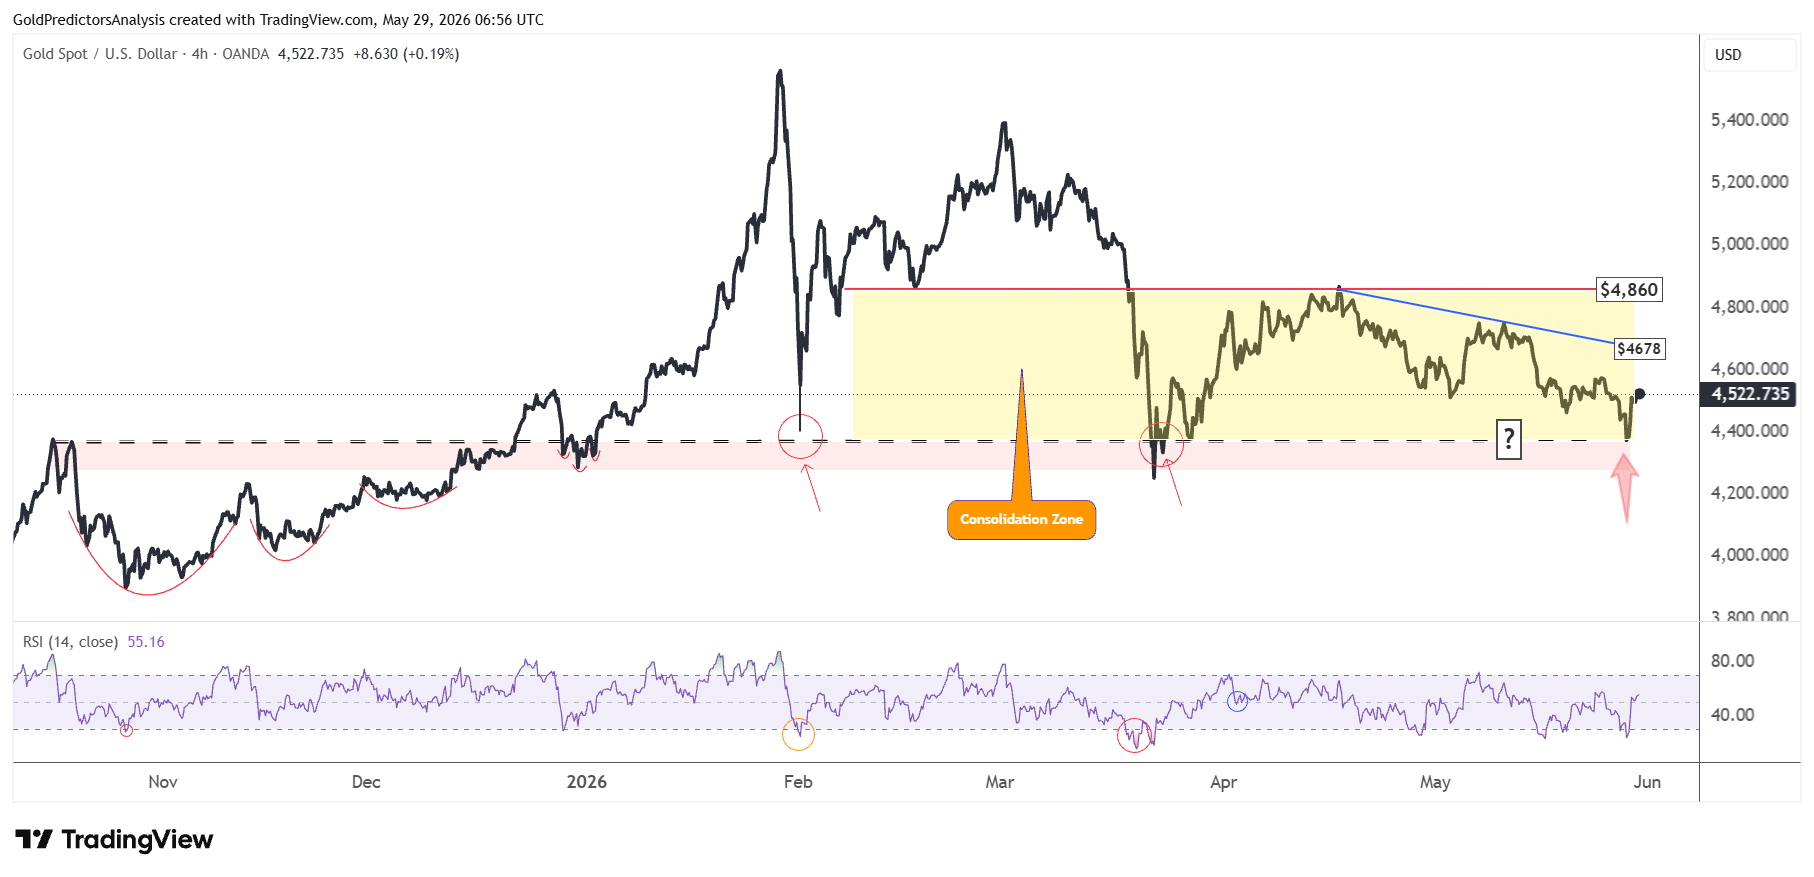
The strong consolidation is also evident on the 4-hour chart, which shows consolidation within the yellow highlighted region. The 50-day SMA resistance also collides with the $4,678 resistance seen by the blue trend line. Therefore, a break above $4,630 to $4,678 zone will push prices toward the $4,860 level.
But a break of $4,860 or $4,360 will define the next move in the gold market. The RSI indicator also shows strong consolidation within this range.
Gold Price Forecast
Every new Gold analysis as it publishes, today's technical signal and key levels, live price — on one page.
See all Gold forecastsSilver Price Forecast: Bullish Hammer Forms Above $70 Support
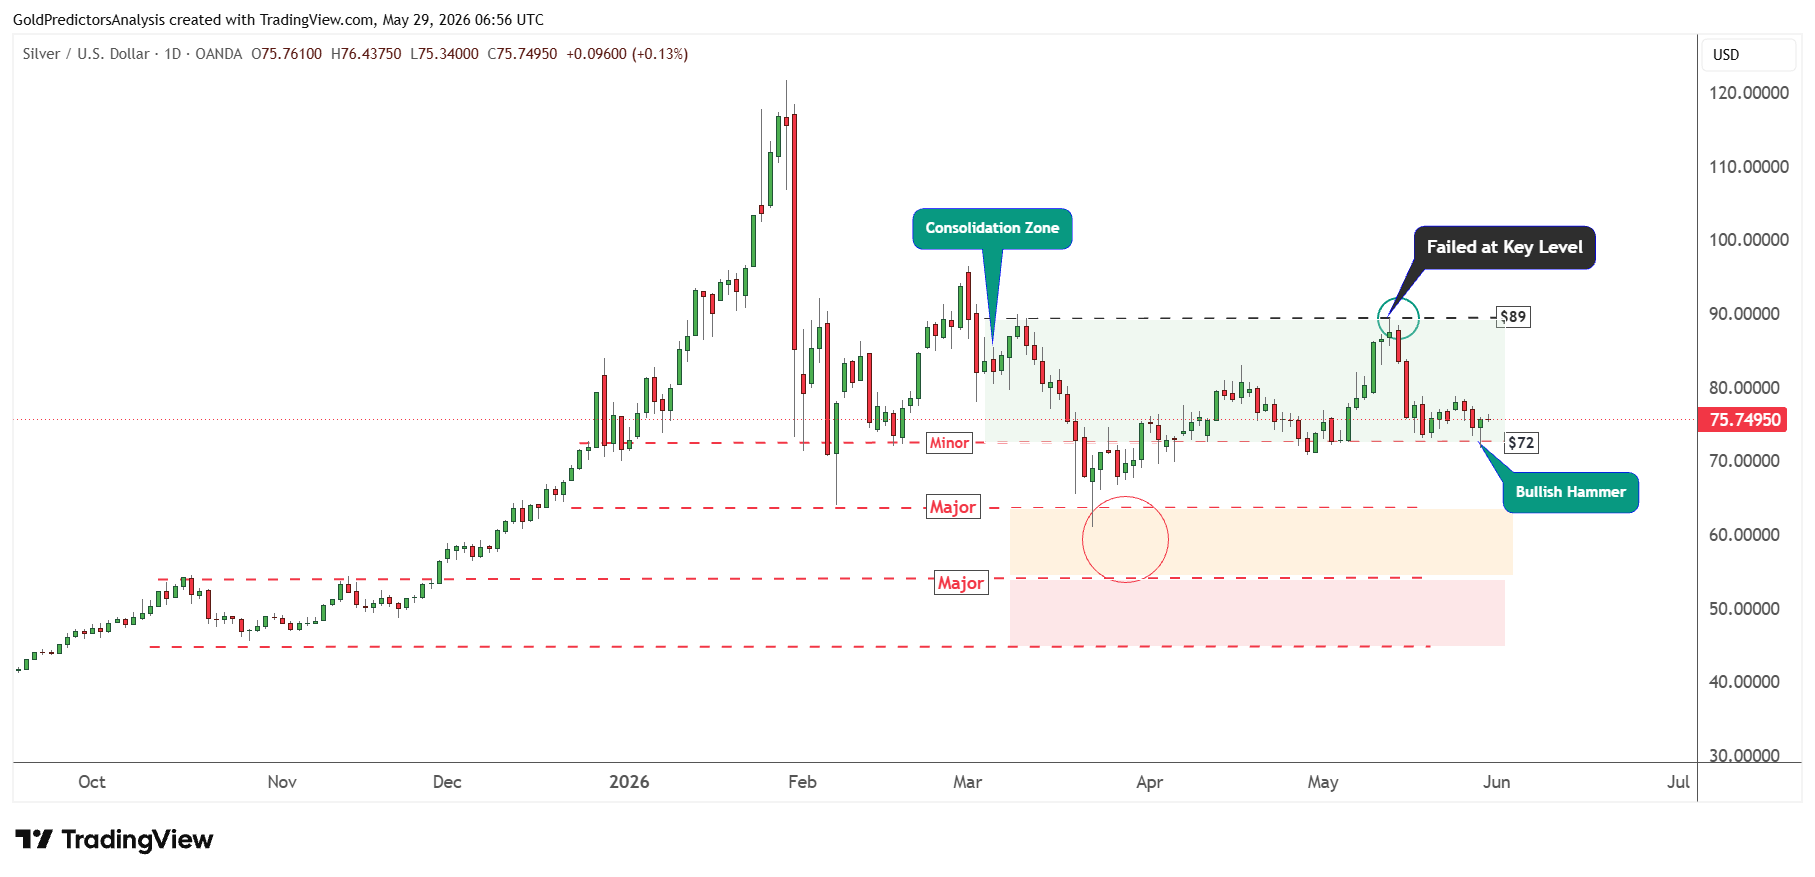
The daily chart for spot silver shows that silver failed to break below the $70 region and produced a bullish hammer candle in a similar way as the gold price produced above the $4,360 level.
This bullish hammer candle indicates strength in silver in the short term. However, the price must break above the $78 to $79 level to trigger the next move toward the $89 area.
Silver shows consolidation between $70 and $89. A break of these levels will push prices in the next direction. A break above $89 will confirm the bottom in silver. This bottom will push prices toward $120.
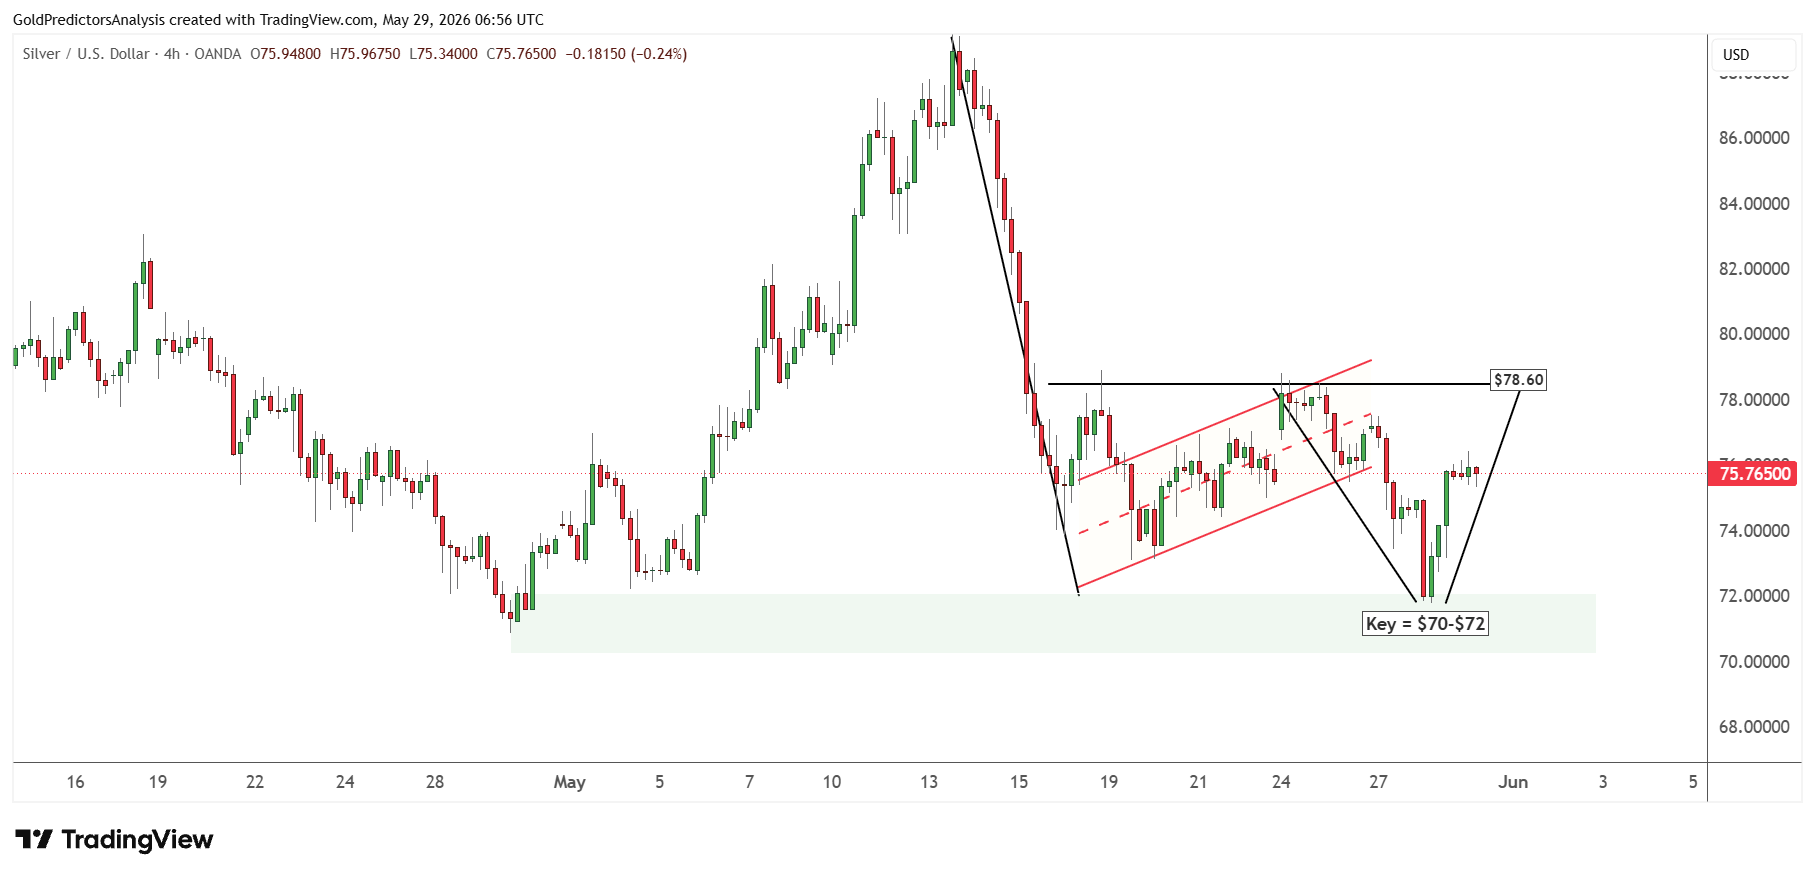
The short-term price structure for silver shows that the price followed the bear flag pattern, as discussed in the previous article. After breaking the bear flag, the price reached the key level of $70 to $72.
I mentioned in the previous discussion that silver needed to break below the $70 to $72 area to confirm the next directional move. But the low formed at the $71.83 level. This key zone is still important and protects the downside in silver prices.
Now, silver price is consolidating to find the next move. Silver price must recover the $78.60 level to confirm that the short-term price is showing strength. Until this level breaks, silver remains in the consolidation phase.
Final Words
Gold and silver are still in consolidation after this rebound. The spot gold price is rebounding from the lower end of this consolidation at $4,350, while the spot silver price is rebounding from the lower end of support of this range at $72. Gold must break above $5,000, and silver must break above $89 to break this consolidation range and initiate the next upward move. These metals are still sensitive to news from the United States and Iran, inflation data, and interest-rate expectations for now.
Read more: Bearish Breakdown May Set Up the Next Silver Rally