


Gold (XAUUSD) and silver (XAGUSD) remain under pressure due to the lack of clarity from the U.S.-Iran conflict and the Federal Reserve. Gold consolidates around $4,500 while silver consolidates around the $76. There does not appear to be any significant bearish breakdown in the market, but the overall trend is weak. The extended consolidation over the past seven days suggests that traders wait for the next big catalyst to emerge in a stronger position.
The U.S.-Iran conflict remains the main geopolitical event for precious metals. A progress of the peace talks would lead to a reduction in the demand for safe havens in gold and silver. This would increase the pressure on both metals. But fresh attacks near the Strait of Hormuz can keep the uncertainty high. In case of renewed conflict, a pullback in gold might get some support from safe haven buying and silver could be more volatile as it’s also driven by industrial demand and risk sentiment.
The Federal Reserve is now yet another risk for precious metals. Investors await Fed’s comments and PCE inflation data. An unexpectedly strong inflation report could boost bond yields and strengthen the U.S. dollar. That would fuel further pressure on the gold and silver prices as there would be more opportunity costs associated with holding gold and silver.
Any increases in silver prices may be an additional challenge if growth prospects are reduced. The two metals are still at risk on the downside unless geopolitical worries return to take a higher bearing or the inflation data disappoints.

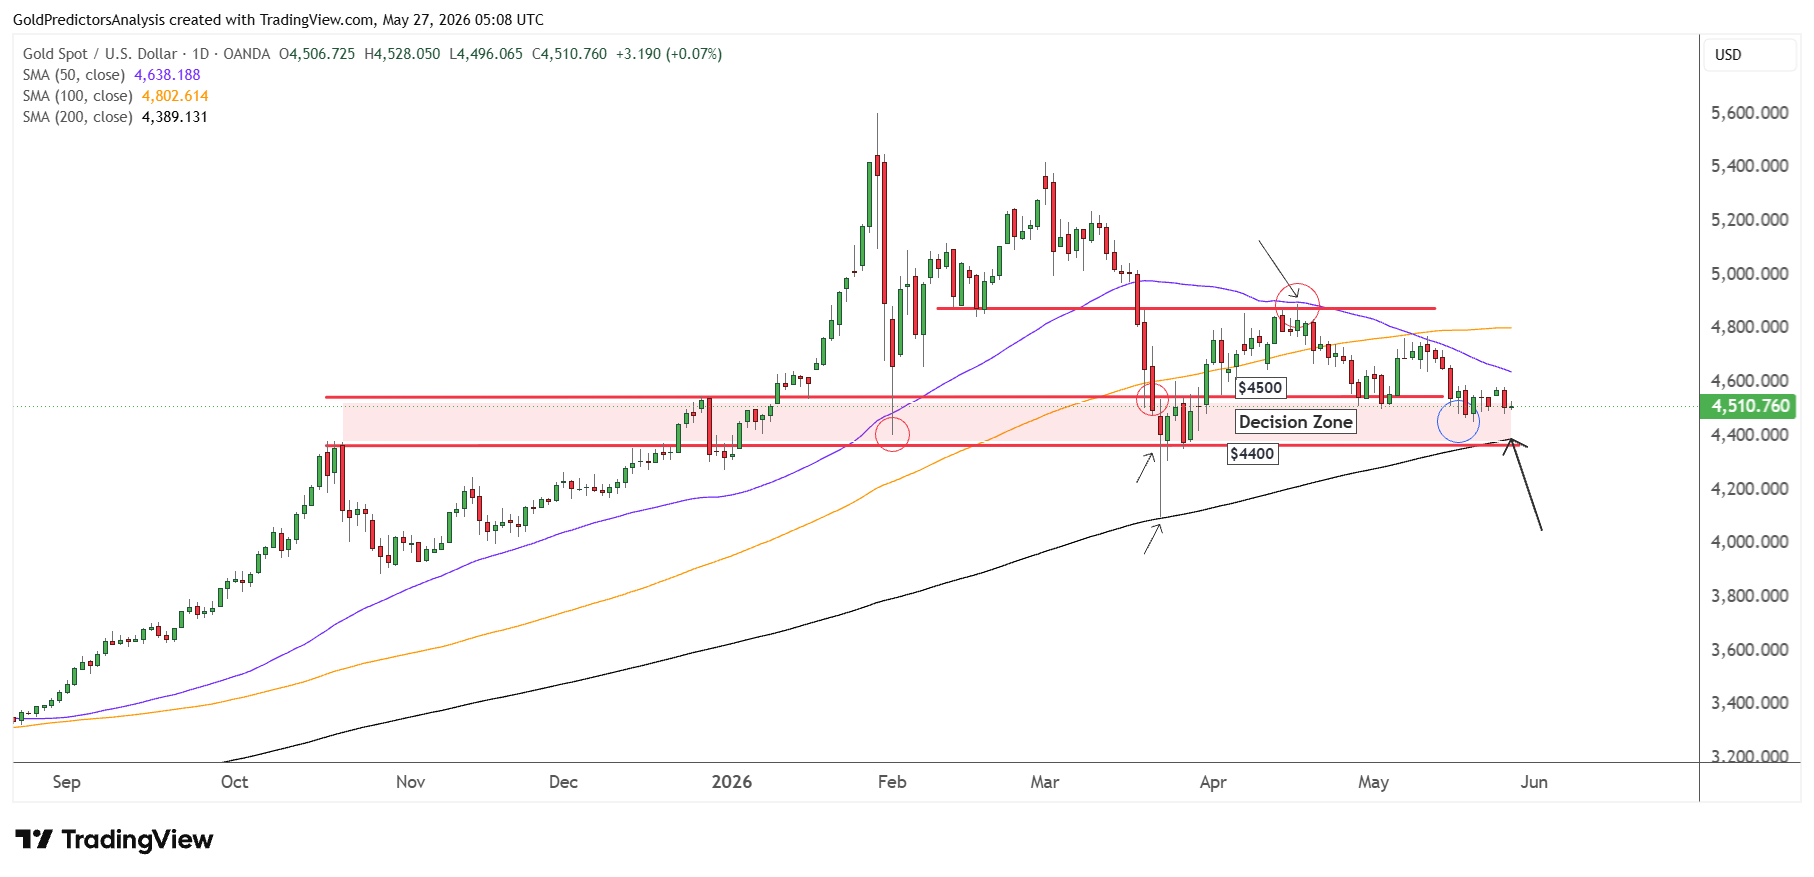
Gold Forecast: $4,400 Support Becomes the Key Breakdown Level
The gold price shows bearish pressure below the 50-day SMA and is moving into the decision zone. This decision zone lies between $4,350 and $4,400. The 200-day SMA now lands at $4,389, which is important key level. A break below this level will likely trigger a strong drop in gold prices. But a recovery above the 50-day SMA at $4,640 will likely offer a fresh rally toward $5,000.
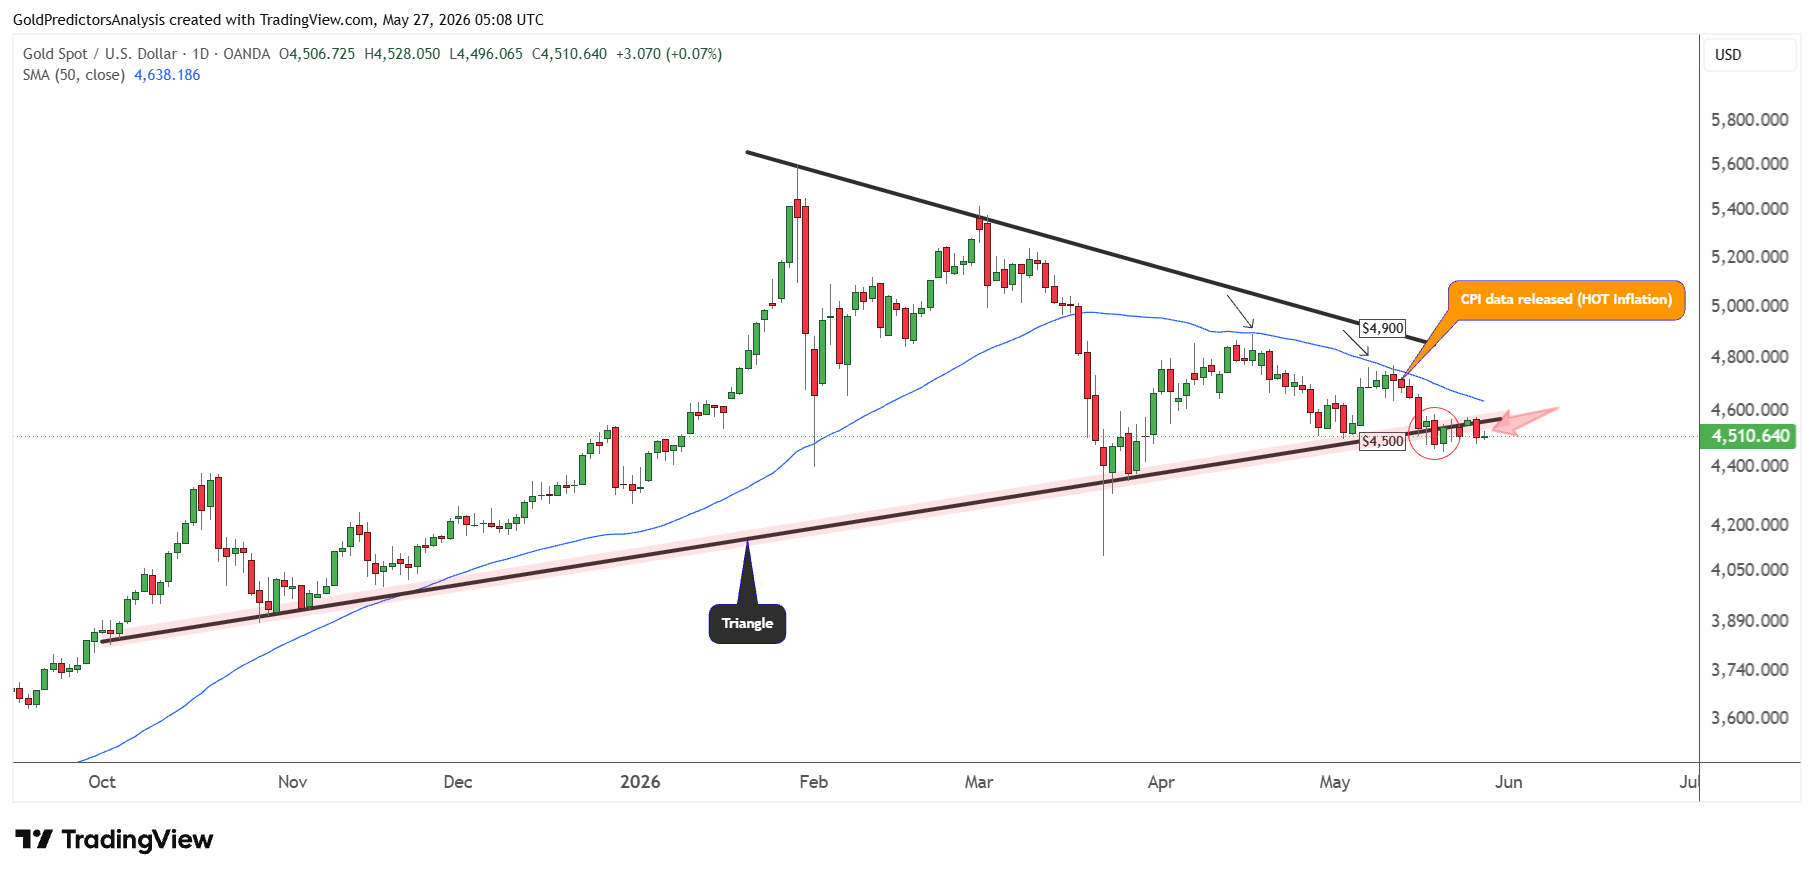
This bearish pressure is also observed on the daily chart, which shows that the price has been consolidating at the support line of the symmetrical triangle pattern over the past seven days. However, the past seven days of price action have been negative. This calls for the possibility of a downside breakout in the gold market. This bearish pressure in gold began after the release of the CPI data, when gold was attempting to break above the 50-day SMA.
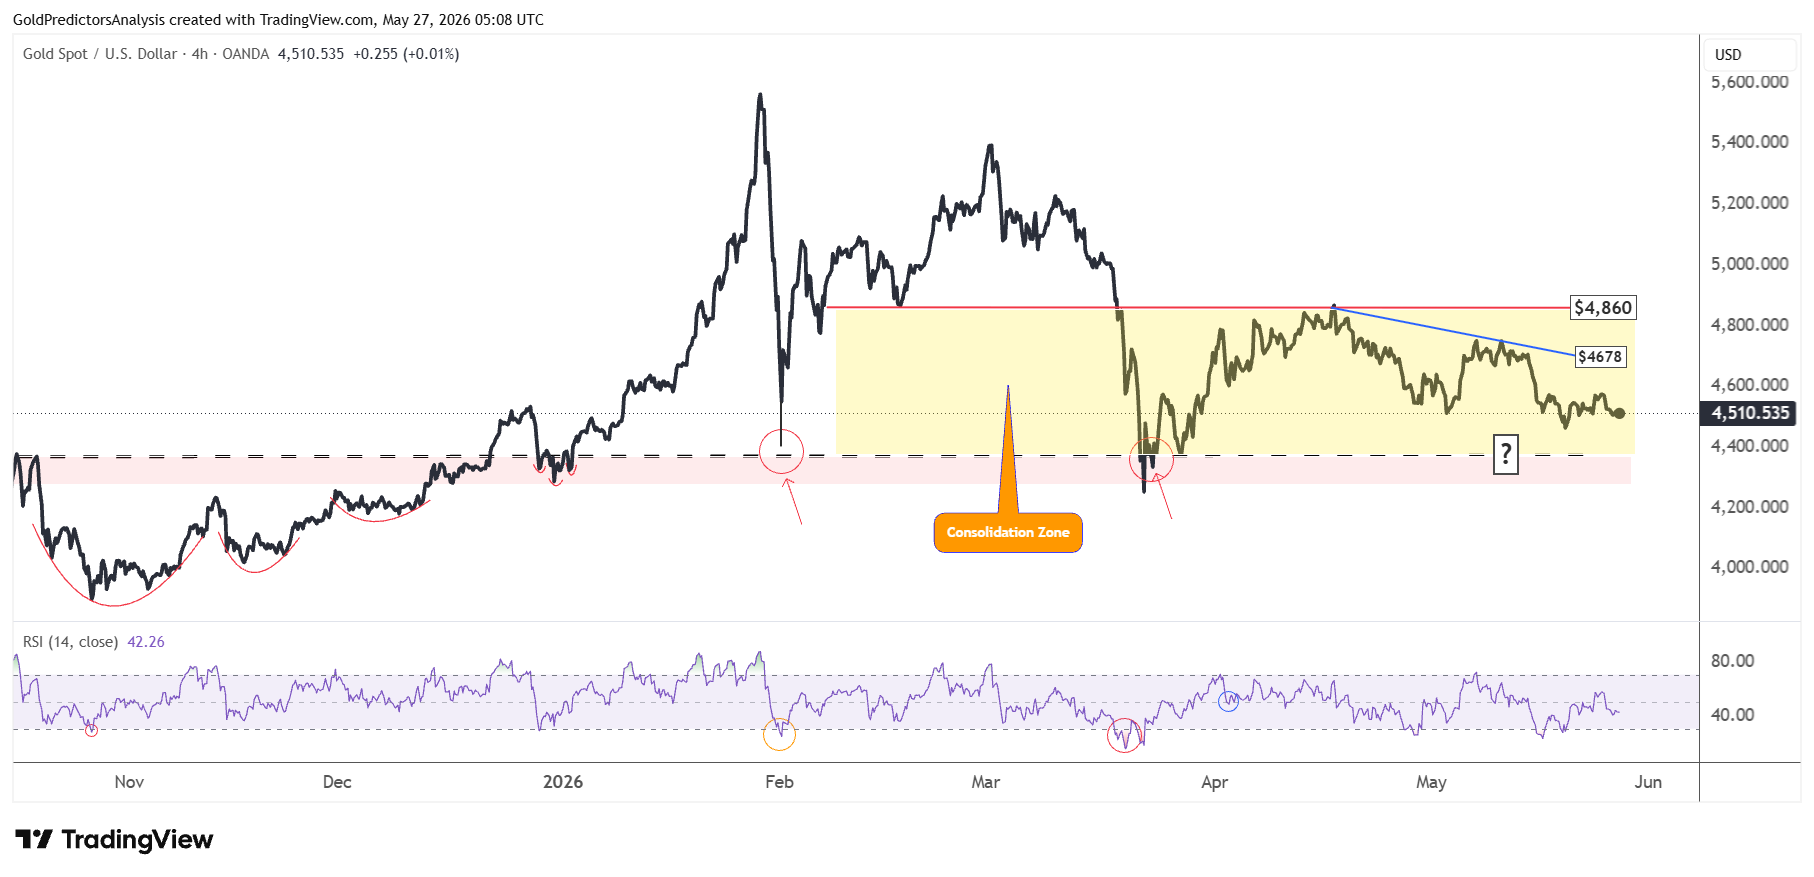
The short-term price action also shows strong consolidation between the $4,350 and 4,860 zone, as shown by the yellow zone in the chart below. A break above $4,678 at the blue trend line will likely trigger fresh upside toward $4,860. However, a break below $4,400 will likely offer fresh downside in the gold market.
Gold Price Forecast
Every new Gold analysis as it publishes, today's technical signal and key levels, live price — on one page.
See all Gold forecastsSilver Forecast: Bear Flag Pattern Points to Fresh Downside Risk
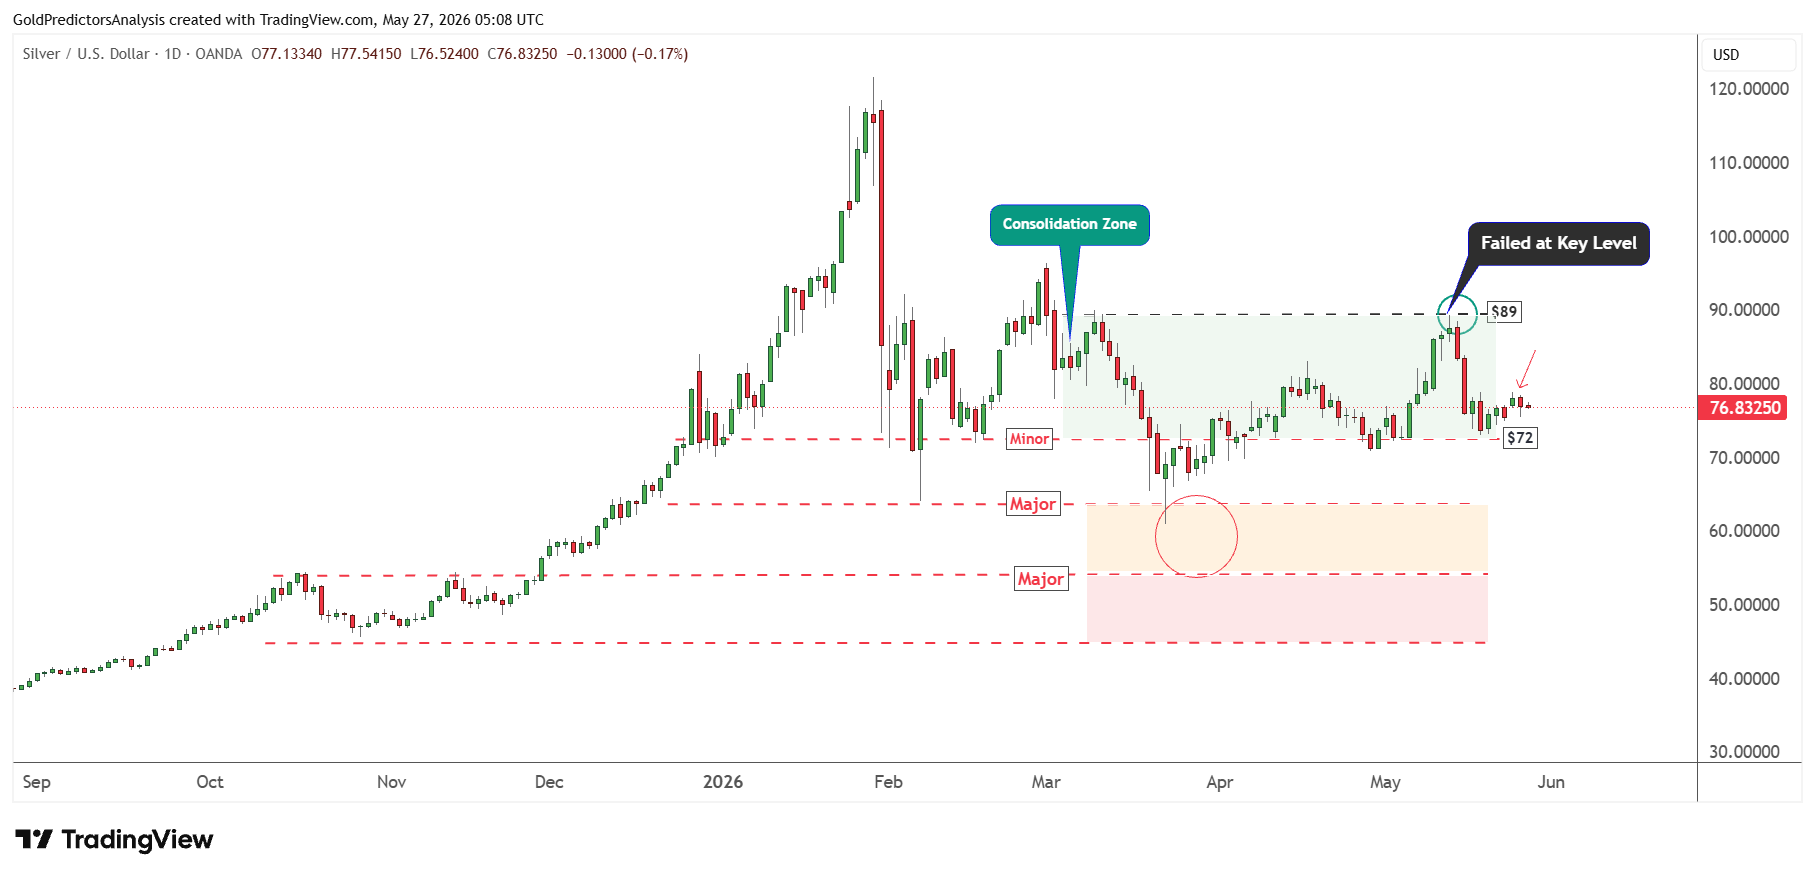
The silver price also shows negative price action after failing to break above the $89 area. The rebound from the $72 support is weak and suggests the possibility of a downside break. A break below $70 will likely offer fresh downside toward the $50 to $60 area. This area is considered a strong long term buying region in the silver market.
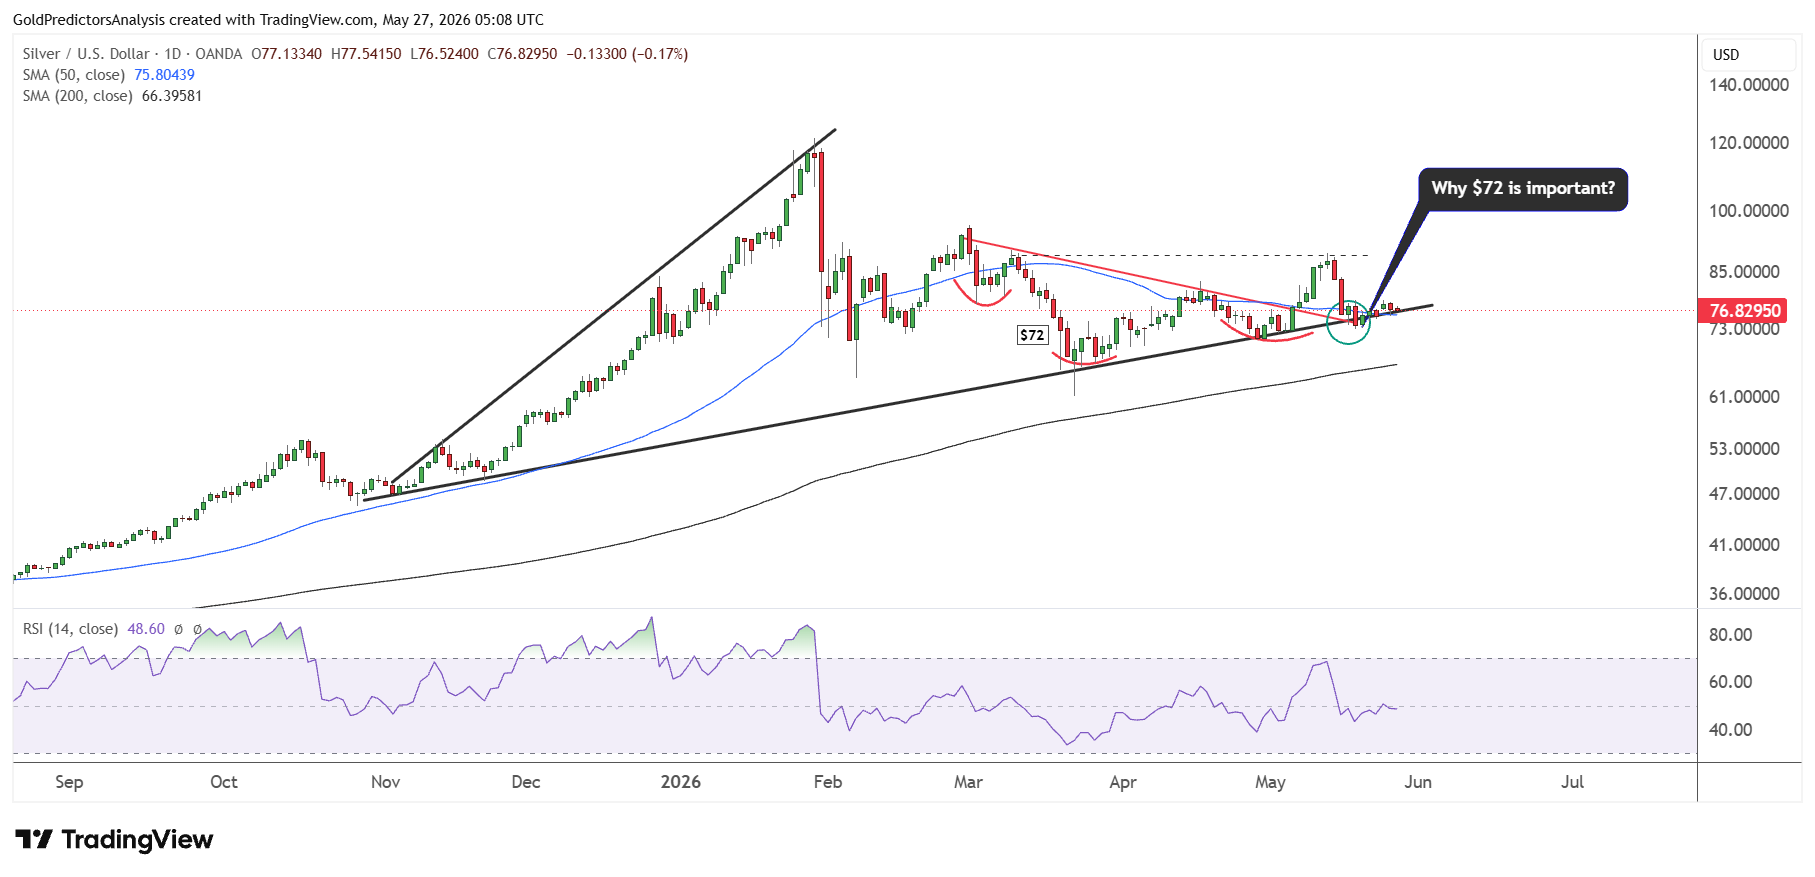
The importance of the $72 region is also highlighted by the ascending broadening wedge pattern in the chart below. The price consolidates above the intersection of the red trend line and black trend line which is considered an important juncture. A break below $70 will take prices directly toward the 200-day SMA at $65. Moreover, the RSI remains below the midline, which indicates negative pressure on silver prices in the short term.
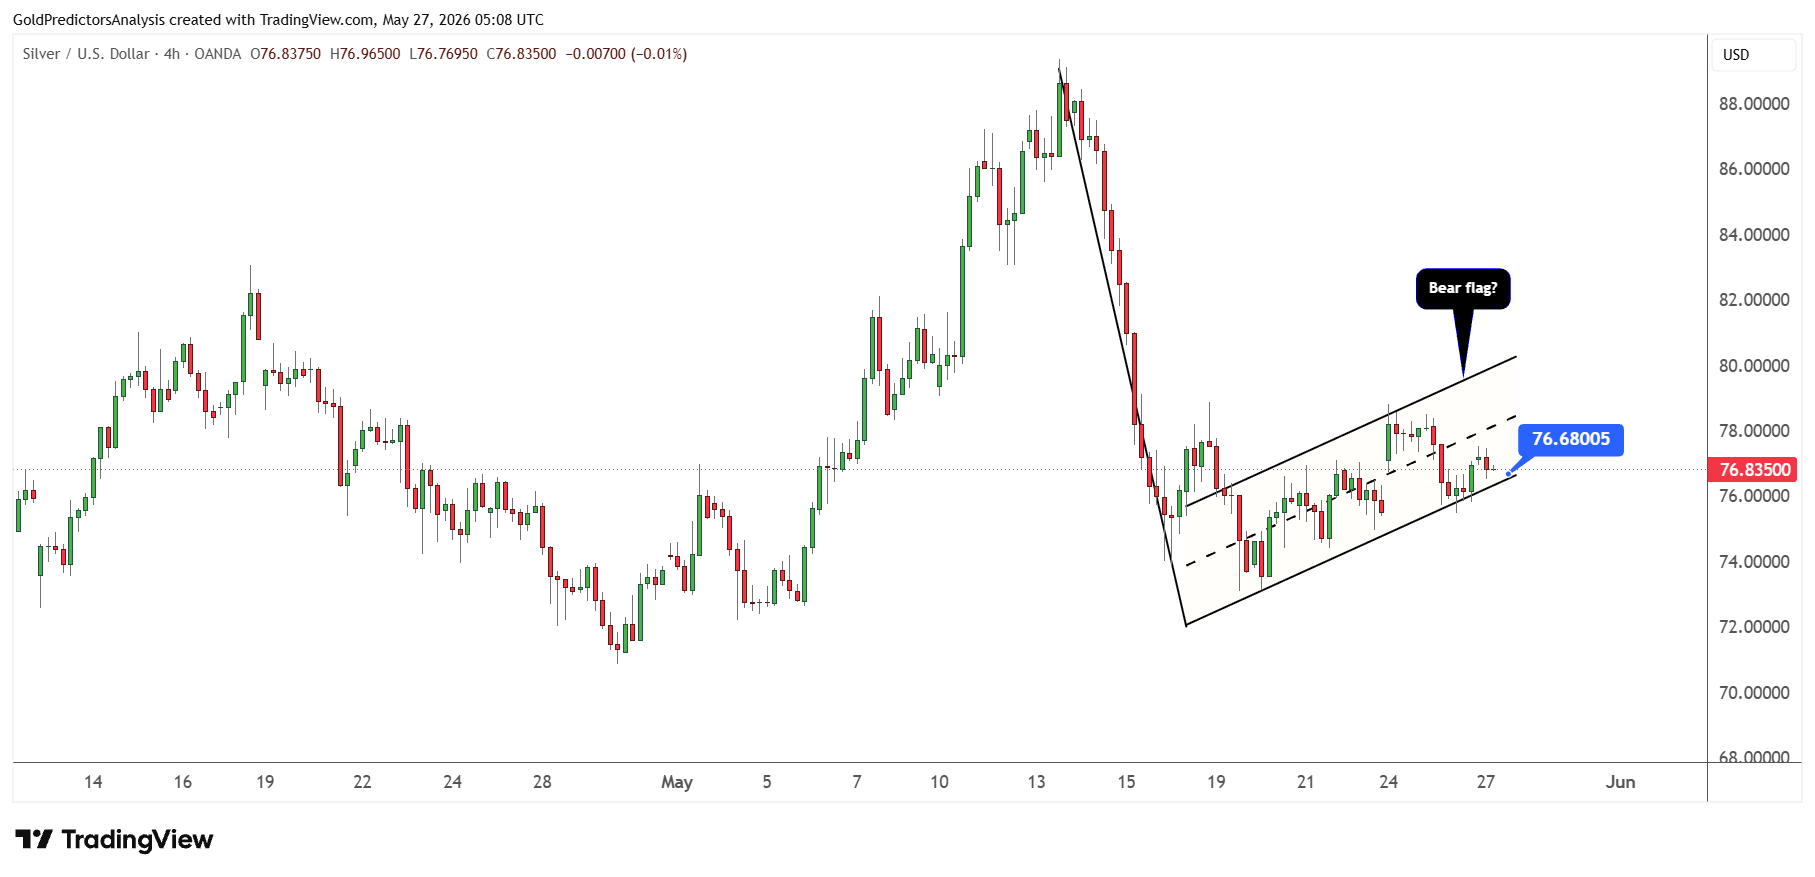
This pressure is also observed using the formation of the bear flag pattern. This pattern indicates that a break below $75 will likely trigger a drop toward $72. The bear flag pattern likely increases the likelihood of a breakdown below $70, which will take prices to $50 to $60.
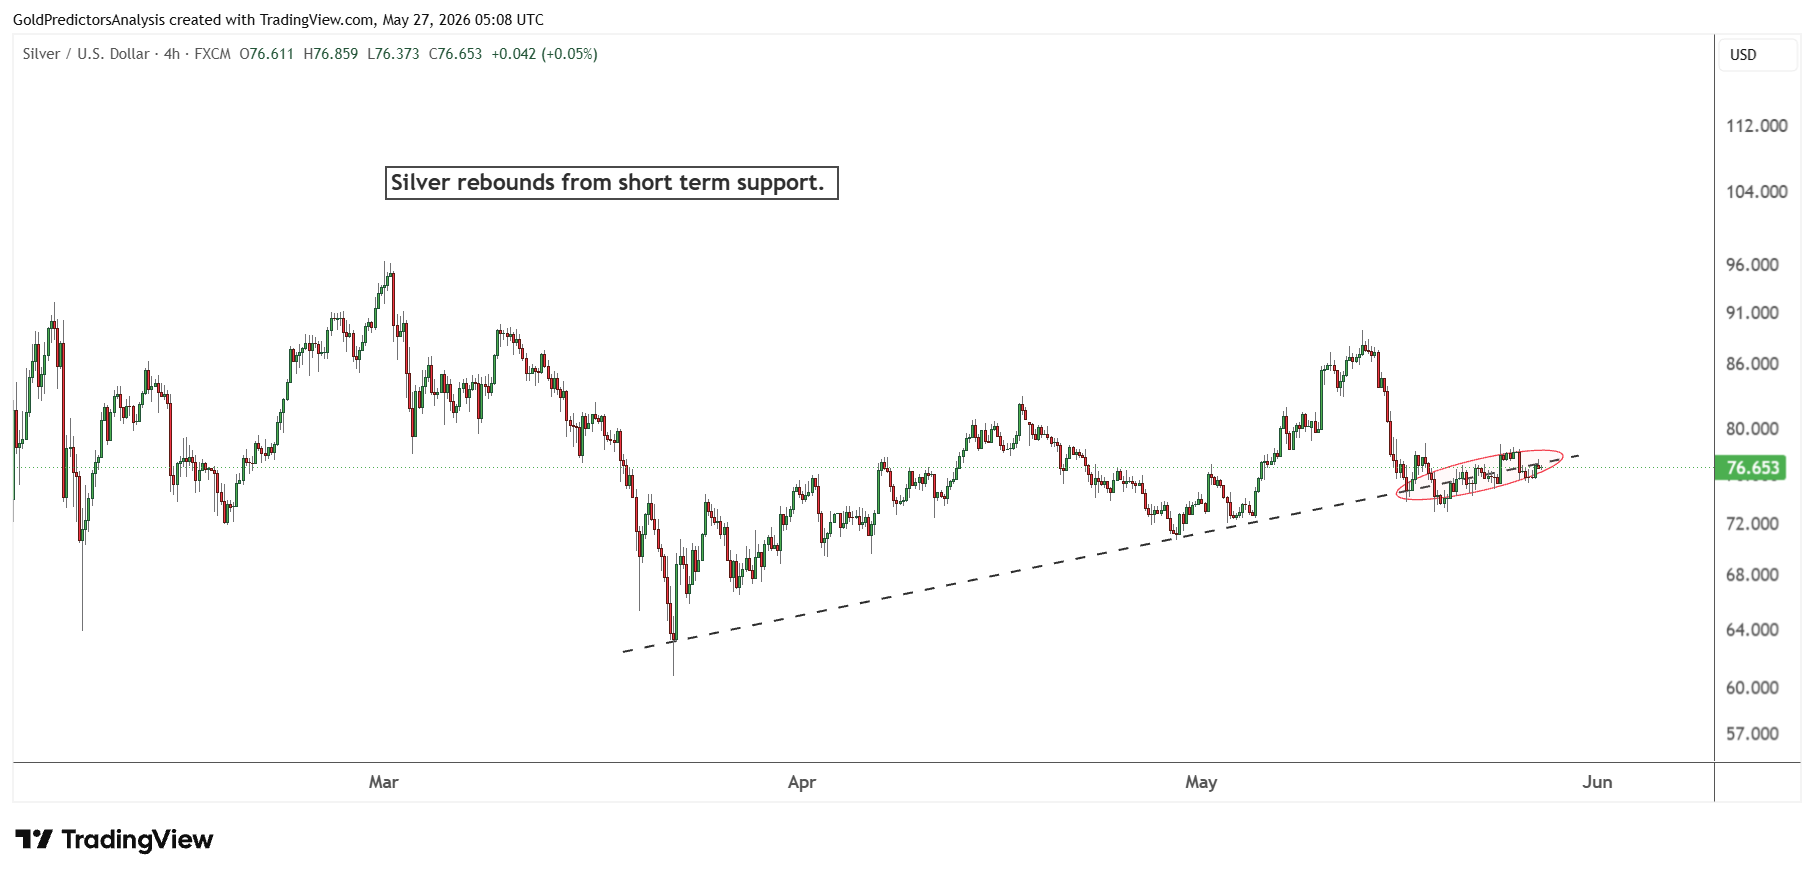
The bearish price action is observed using the 4-hour chart, which shows that the price has been consolidating around the black trend line. This line is the support line of the bear flag pattern for the past 10 days. This consolidation is a negative sign and indicates that the price remains under pressure.
What is Next for Gold and Silver Prices?
Gold and silver remain at significant decision points and will most likely rely on U.S.-Iran headlines, Fed comments and PCE inflation data for the next big move. The 50-day SMA is a key level at $4,640. If gold holds above this SMA, it will gain bull momentum and move to $4,860 and $5,000. A break below $4,400 will confirm fresh downside.
In addition, Silver remains weak following the failed attempt at $89. The bearish pressure is building by forming bear flag patterns. If the price breaks down below $70 it will uncover the $65 price and potentially the $50-$60 support zone. For now, both metals have been under pressure, but a new geopolitical event or some disappointment with inflation data may soon lure buyers back in.


