Gold Lost to the Rate Trade on a Day It Should Have Rallied
Spot Gold (XAUUSD) settled at $4,120.67 on Friday, down $3.12 or -0.08%, extending its weekly decline. Iranian forces hit U.S. military facilities across Gulf states, explosions were reported near Iran’s nuclear infrastructure, and tanker traffic through the Strait of Hormuz stayed close to a standstill. That is a session where gold should be running. Instead it finished lower because oil’s rally reset the inflation outlook, September rate hike odds crossed 50% for the first time, and the yield market repriced before gold had a chance to catch a geopolitical bid. Gold traders already know what sustained high oil prices do to the rate outlook. Friday confirmed it.
Oil Ran the Session and Gold Paid for It
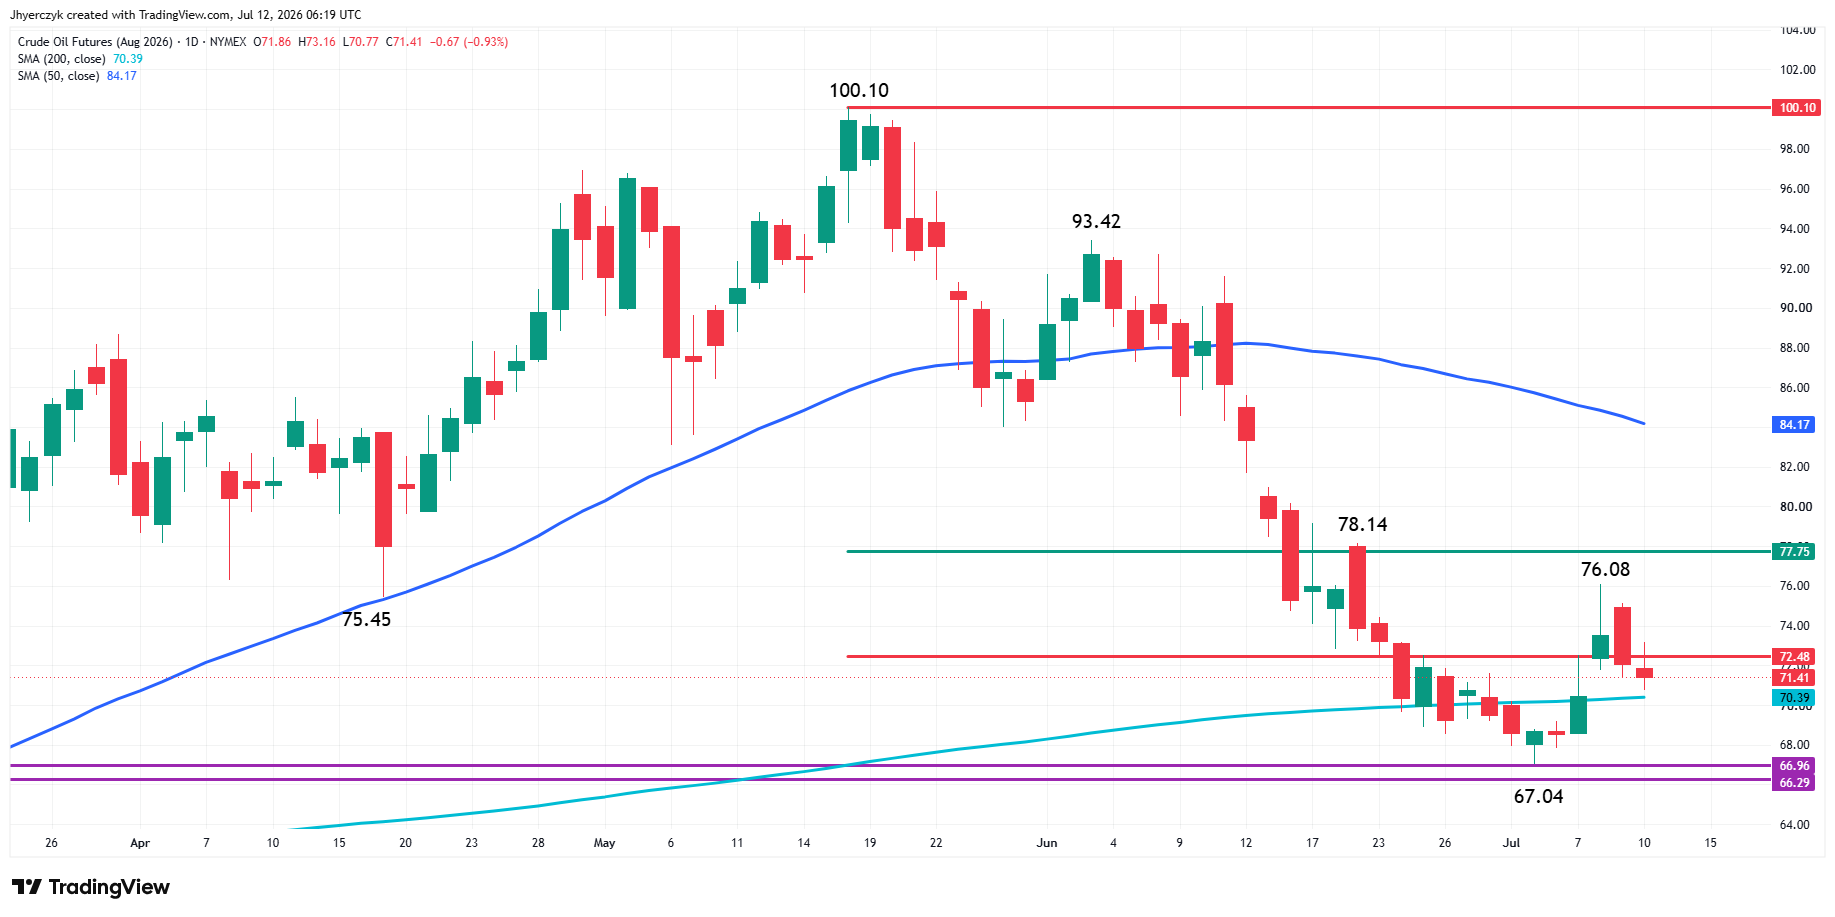
Oil was the dominant driver on Friday and it was not helping gold. The Iran escalation that was supposed to create safe-haven demand for gold instead created an inflation problem that repriced the entire rate curve against it. WTI settled down 0.93% at $71.41 and Brent slipped 0.38% to $76.01. Both pulled back after reports that the United States planned to continue technical talks with Iran and a Qatari delegation visited Tehran to try to ease tensions. Even with Friday’s decline crude was still on pace for a strong weekly gain.
The Strait of Hormuz is the piece that keeps the oil bid alive. Tanker traffic is running well below normal and both sides are still disputing control of the waterway. As long as crude transit stays near a standstill, energy prices stay elevated and the inflation pressure does not let up. That is the chain that is hurting gold right now. Oil runs on the supply disruption, inflation expectations climb with it, the Fed stays hawkish, and real rates stay high enough to keep gold from rallying even on a day full of geopolitical risk.
September Hike Odds Crossed 50% and That Changed Everything
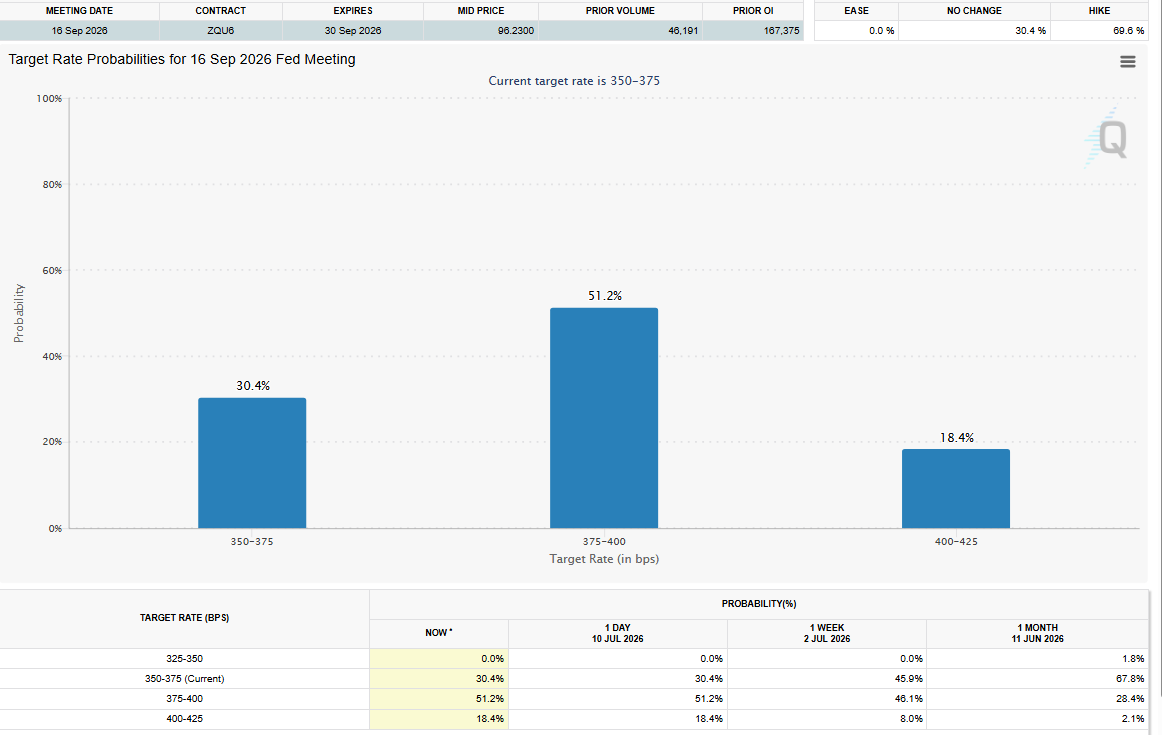
CME FedWatch priced in a 51.2% probability of a September rate hike by Friday’s close. That number crossing 50% for the first time this cycle is a bigger deal for gold than any headline coming out of Iran because it tells you where the money is going. When the bond market prices in a coin flip on another hike, the safety trade goes to Treasuries and the dollar, not gold.
Gold Price Forecast
Every new Gold analysis as it publishes, today's technical signal and key levels, live price — on one page.
See all Gold forecastsThe June Fed minutes backed up the move. Several officials wanted another rate increase before the committee decided to hold at the June meeting. The committee held but the discussion made clear the hawks have not gone away. They are watching the same oil prices gold traders are watching and drawing the opposite conclusion. Rising crude gives the inflation hawks exactly the data they need to push for September and gold has no answer for that as long as the rate repricing continues.
Friday’s session played out as a clean example of the current gold trade. The geopolitical risk was real and escalating. The safe-haven bid that should have followed went to the dollar and Treasuries instead because the market’s first reaction to Middle East escalation right now is to price in a more restrictive Fed. That is not a gold-friendly reflex and it did not change at any point during the session.
Yields Climbed Across the Curve on No Data
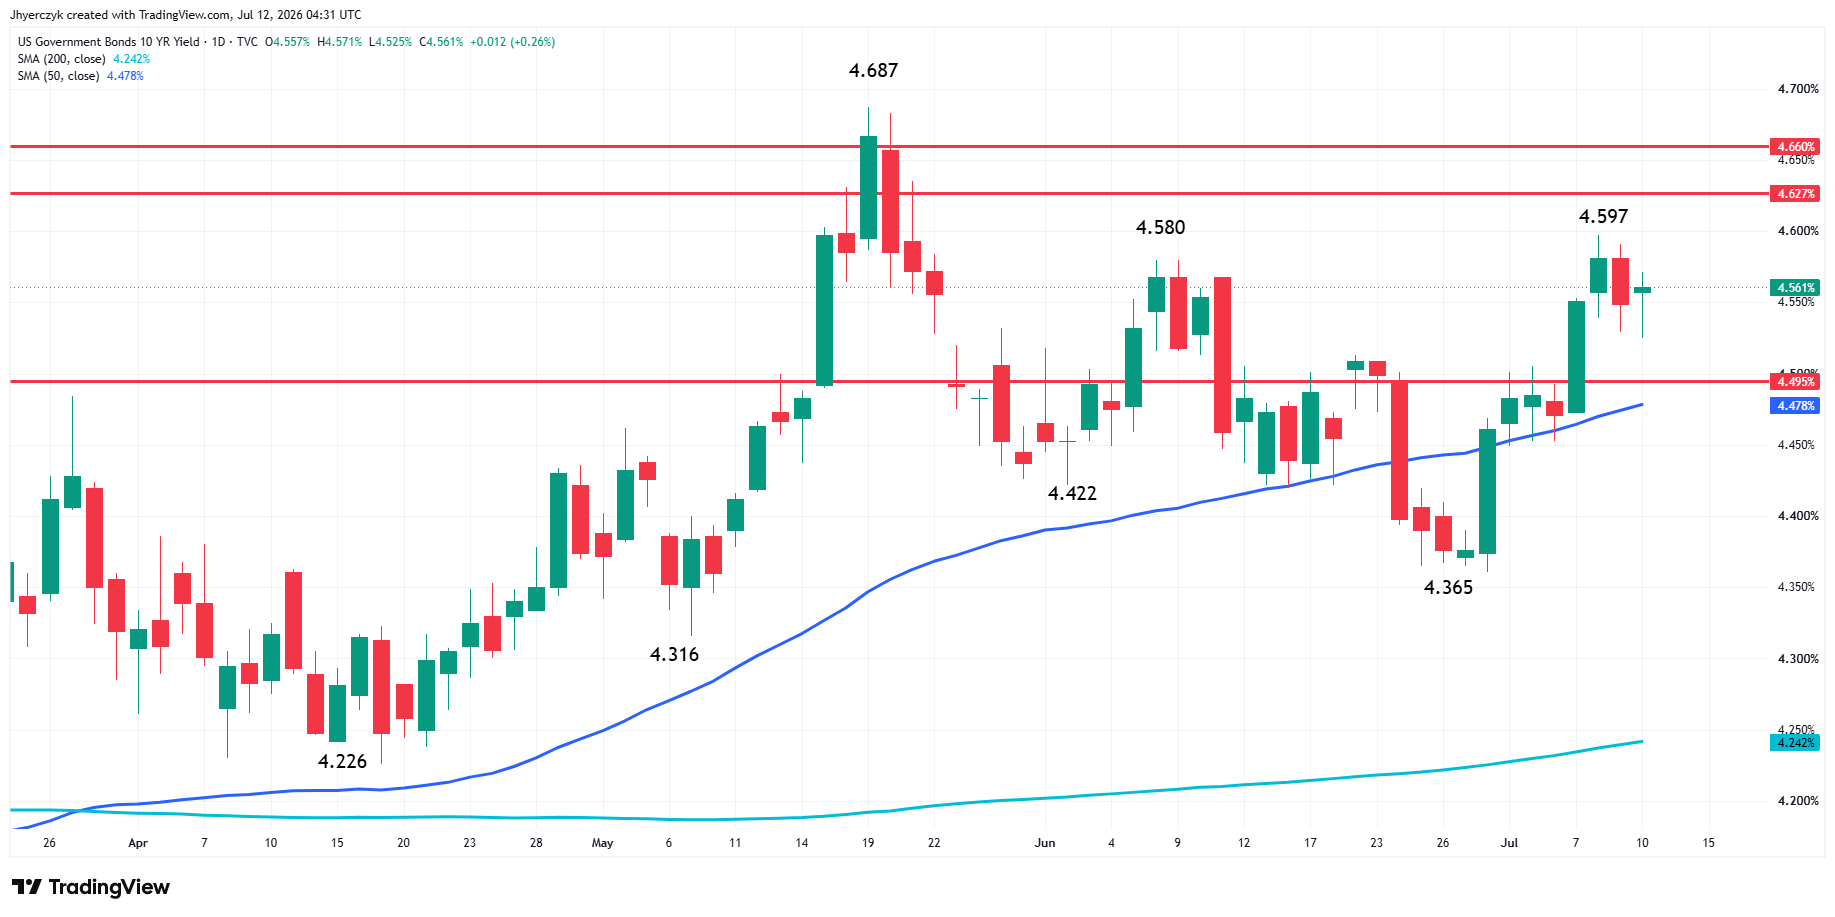
No major U.S. economic data came out Friday and the bond market still moved. The 10-year Treasury yield rose more than 2 basis points to 4.561%. The 2-year climbed more than 4 basis points to 4.208%. The 30-year added less than 1 basis point to 5.062%.
The 2-year moving faster than the 30-year on a day with no data tells you the bond market is pricing in a policy change, not just reacting to noise. Traders are watching oil, running the inflation math forward, and positioning for a Fed that may not be done raising rates.
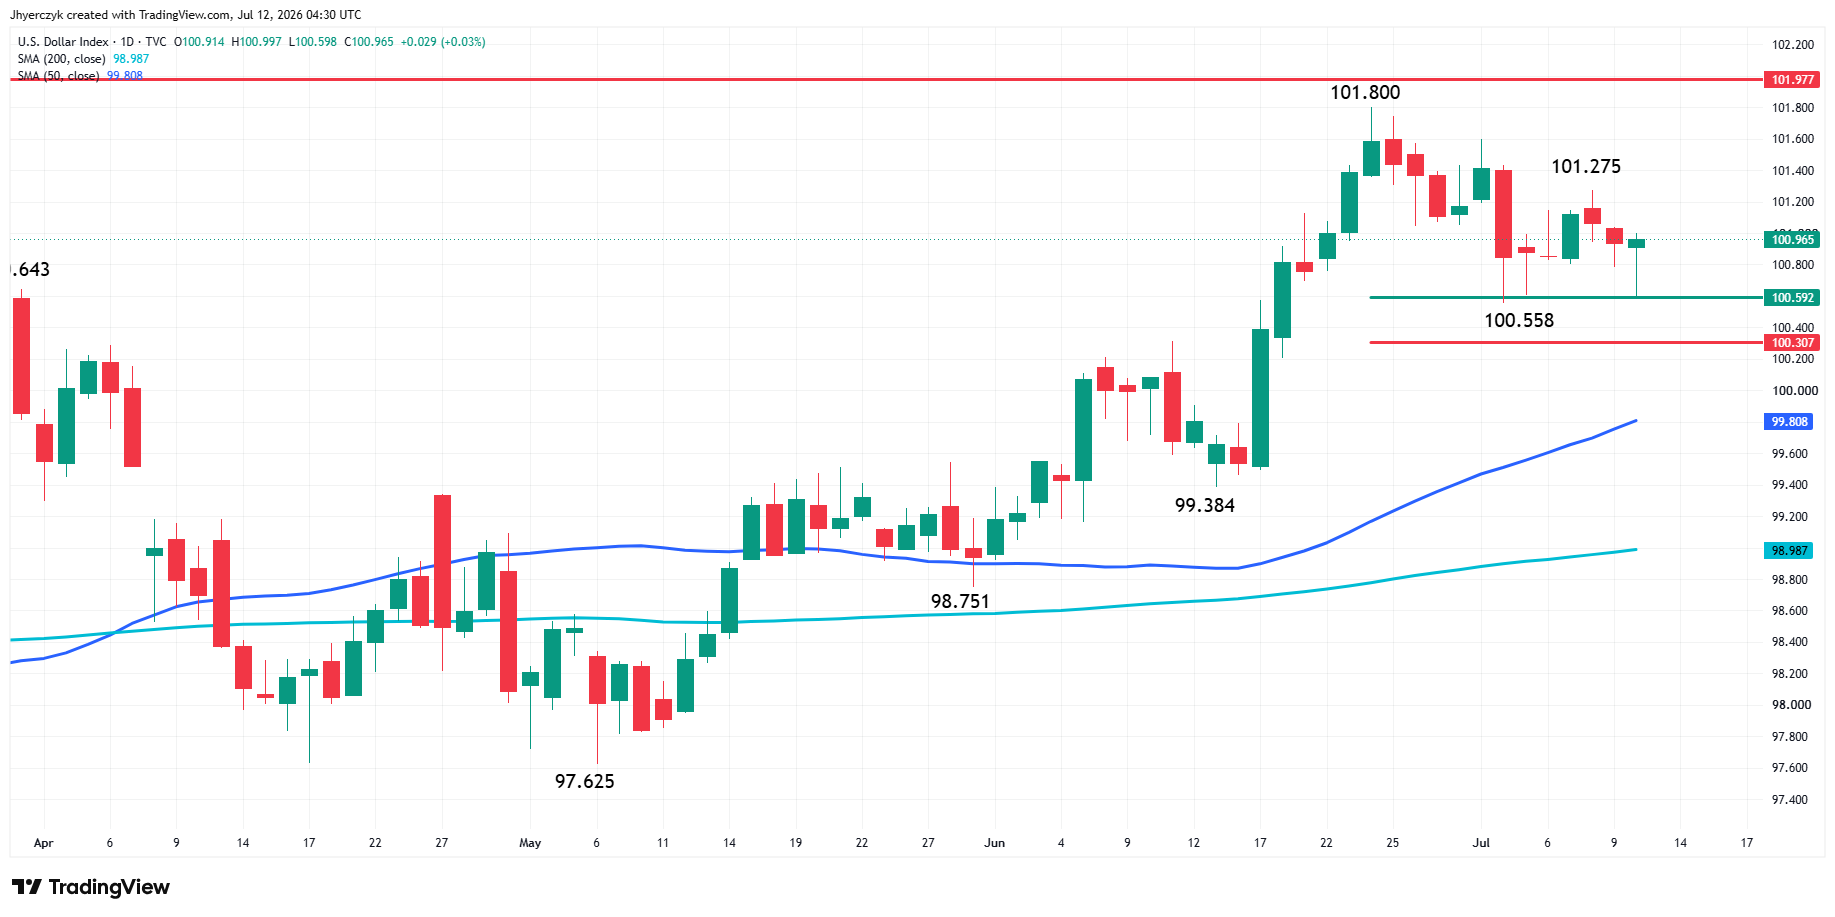
The dollar firmed alongside yields and the combination kept gold locked in a narrow range on a day where the headlines alone should have moved it significantly higher. The geopolitical bid existed. The rate repricing was bigger.
Daily Spot Gold (XAUUSD) Technical Analysis
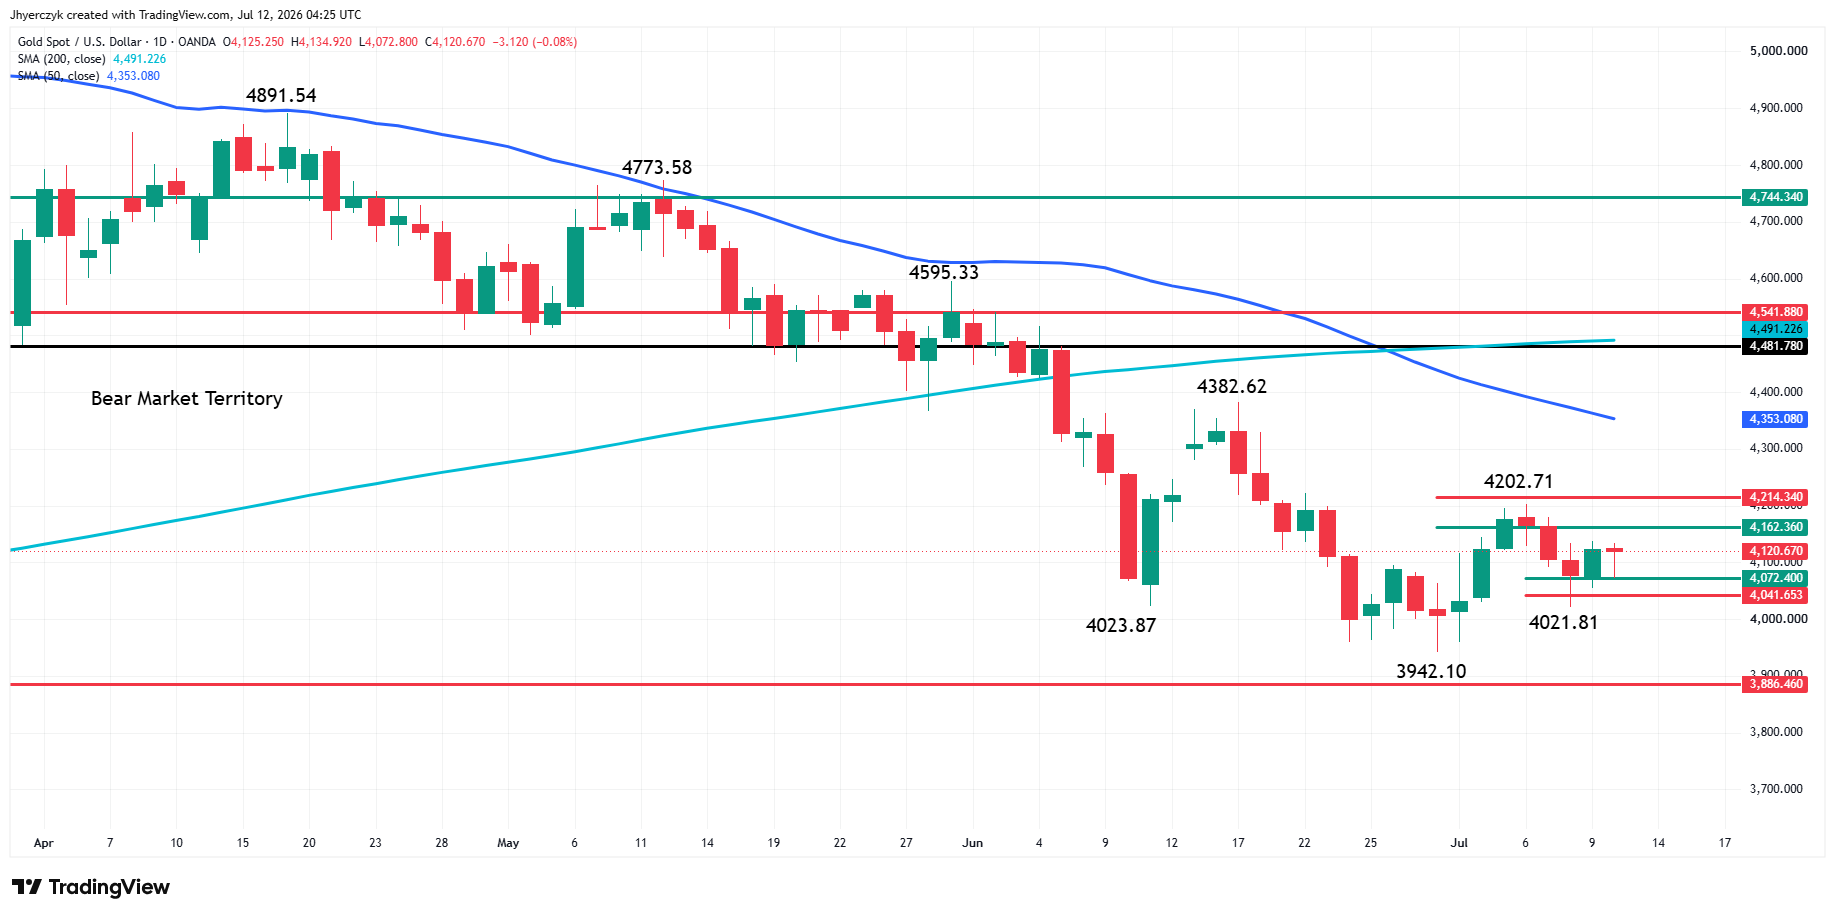
Spot gold finished lower on Friday, between short-term support and minor resistance. The price action suggests investor indecision and impending volatility. Essentially, traders are waiting for a catalyst that will either reaffirm the downtrend or start a meaningful short-covering rally.
The main trend is down according to daily swing chart and the moving averages. The minor trend is edging higher, which is skewing momentum to the upside.
The first important range is $4382.62 to $3942.10. Its retracement zone at $4162.36 to $4214.34 is resistance. It stopped a rally on July 6 at $4202.71. Taking out this swing top will change the main trend to up.
The second range on my radar is $3942.10 to $4202.71. Its retracement zone at $4072.40 to $4041.65 was tested successfully last week although the market dipped to $4021.81 before rebounding to $4138.06.
Bearish traders are going to try to press prices through $4041.65, in an effort to pull-away from the $4202.71 swing top, aiming for a retest of $3942.10 and beyond.
Bullish traders are trying to create a secondary higher bottom at $4021.81, which is the normal precursor to a potential change in trend. To put it another way, $3942.10 to $4202.71, the first rally, was short-covering. The second rally is usually a combination of new buyers and lingering shorts. Counter-trend buyers are also trying to create the upside momentum needed to take out $4202.71, and change the main trend to up.
That’s our early focus for next week, resume the downtrend under $4021.81 or change the trend over $4202.71.
Until the market changes the trend to up, we’re not too concerned about the moving averages although they are trending lower.
What to Watch
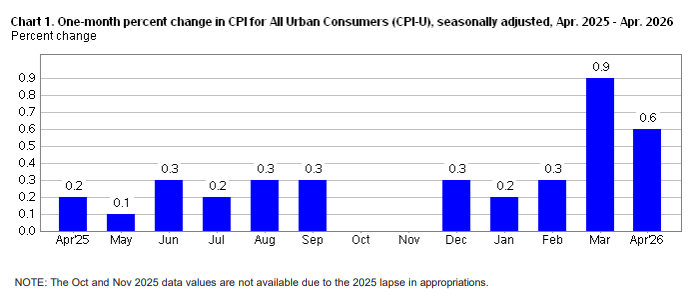
The Consumer Price Index report next week is the first real test for a market that just watched September rate hike odds cross 50% for the first time this cycle. If that number comes in hot, the hike trade accelerates and gold stays on the wrong side of rising yields and a stronger dollar. If it comes in cooler than expected, the 51.2% probability on Friday starts leaking back toward the low 40s and gold gets a window to rally before the next round of data resets the conversation. Either way the print is going to move the bond market and gold is following the bond market right now, not the geopolitical headlines.
Fed Chair Kevin Warsh testifies before the House Financial Services Committee the same week that CPI lands. He is going to walk into those hearings with hike odds above 50% on the screen and the questions are going to come whether he wants them or not. Warsh has not been giving much away on forward guidance but the market does not need him to talk. It needs the inflation data to confirm or reject what the bond market priced in on Friday. Oil is the wild card underneath all of it. The Strait of Hormuz is still not moving crude at normal levels and every week those barrels stay off the market is another week that energy costs feed directly into the next inflation reading.
The technical picture narrows the trade to two levels. A hold above the secondary higher bottom and a push through the nearest swing top changes the main trend to up and brings in new buyers on top of the short-covering crowd that drove the first rally. A failure below that bottom resumes the downtrend and opens the path back toward the recent low. Gold is sitting between those two triggers and next week’s CPI is the most likely catalyst to break one of them.
More Information in our Economic Calendar.