
Natural Gas Broke $3 and Found Few Buyers
August Nymex natural gas settled at $2.94, down 7.2 cents or -2.39%, the third straight day of selling and the lowest close for a nearby futures contract in about six weeks. Cooler weather forecasts pulled the demand bid out from under the market and there was nothing underneath it. Production is running 5.2% above last year, storage is 185 billion cubic feet above the five-year average, and the weather models just took away the one thing that was keeping a floor in place. The bulls have no argument right now.

Daily August Natural Gas Futures Technical Analysis
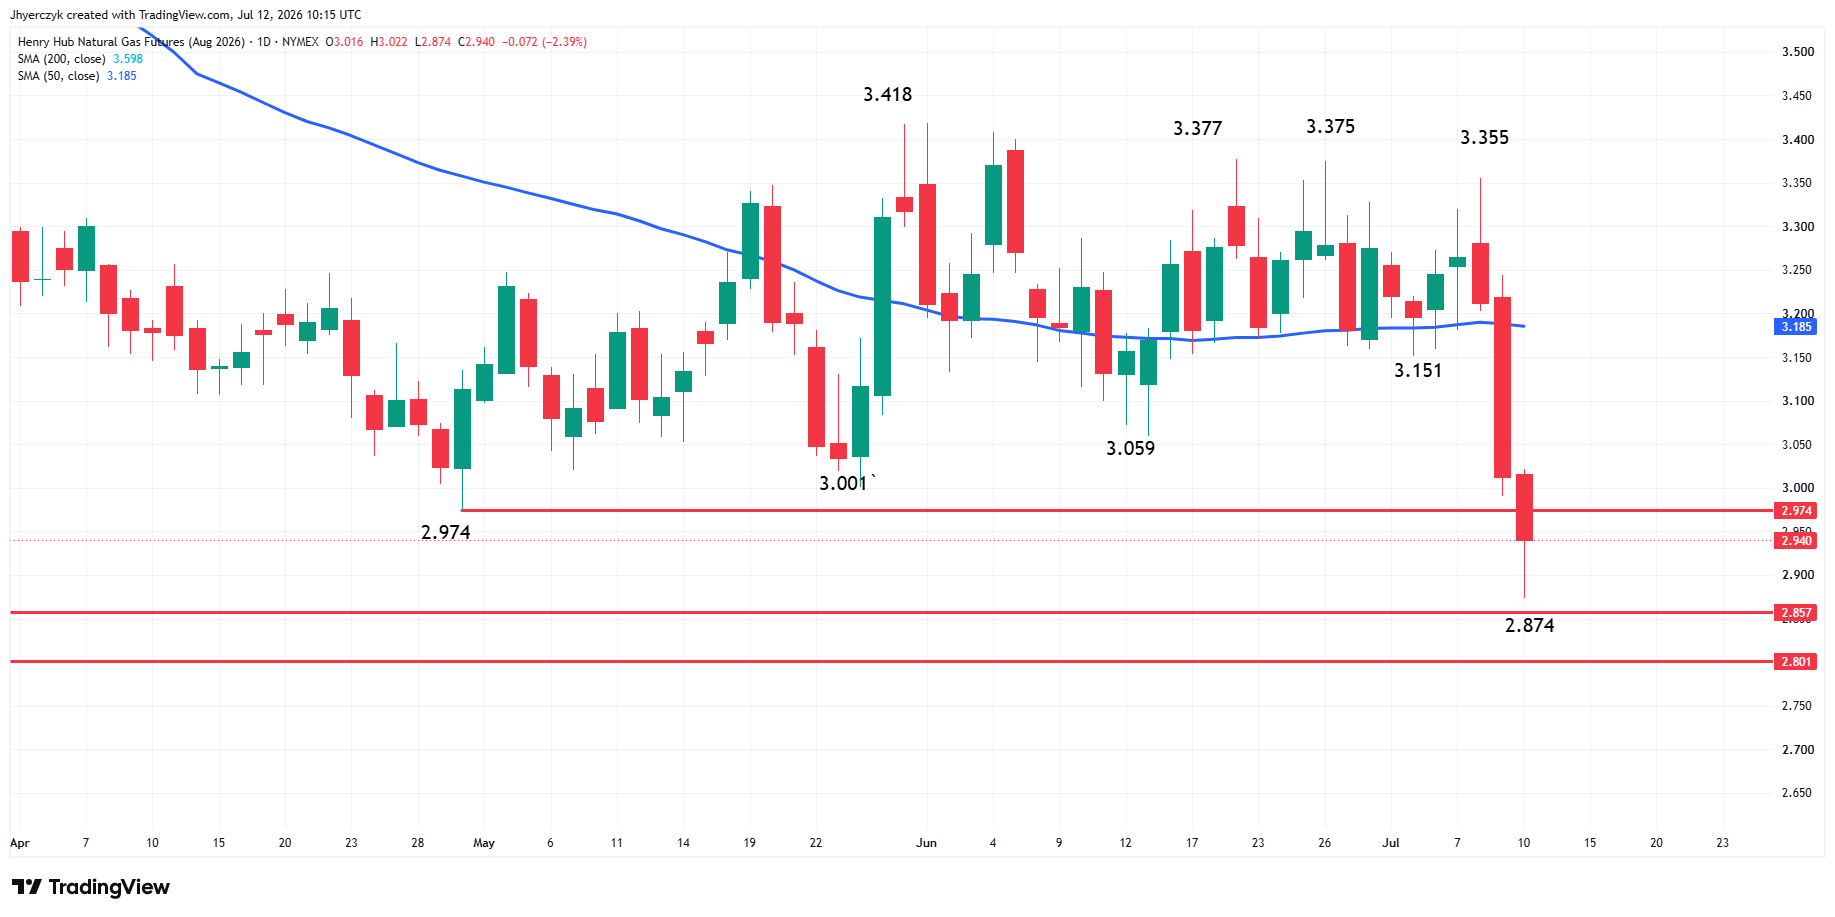
August Natural Gas futures continued its sell-off for a third session on Friday. After smashing through the April 30 bottom at $2.974, the market fell sharply to $2.874 before rebounding into the close at $2.940.
I don’t chart nearly natural gas futures as a continuous market, I chart the entire futures contract because I trade pattern, price and time indicators. So I had to go back to December 2021 to find support for the August 2026 futures contract at $2.857. If this price fails, the next support target is $2.801.
The new short-term range is $3.355 to $2.874. If we get a normal technical bounce then we could see a move into its 50% to 61.8% zone at $3.115 to $3.171. Since the main trend is down, sellers could re-emerge on a retracement back to this area.
I expect many retail speculators will be looking at this sell-off and their indicators and oscillators for “oversold” signals but the true sign of an oversold market will come from the Commitment of Traders report.
Natural Gas Price Forecast
Every new Natural Gas analysis as it publishes, today's technical signal and key levels, live price — on one page.
See all Natural Gas forecastsCooler Forecasts Took the Last Bid Out
The weather models shifted cooler across parts of the United States for the coming weeks and that was the trigger for Friday’s breakdown below $3. Buyers stepped back and sellers stayed in control all session. The weaker demand outlook stacked on top of Thursday’s bearish storage reaction and the market had no reason to hold the previous floor.
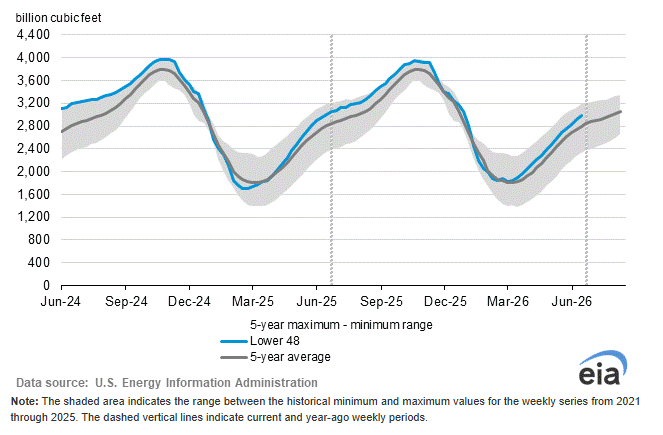
The Energy Information Administration reported that working gas in storage increased by 61 billion cubic feet for the week ending July 3, matching expectations. Total inventories stand at 2,983 billion cubic feet. That is 15 billion cubic feet below the same period last year but 185 billion cubic feet, or 6.6%, above the five-year seasonal average. There is no tightness in this market and the storage numbers keep confirming it.
Production Is Still Climbing and the Rigs Are Not Slowing Down
I keep coming back to production as the reason I cannot get bullish. Lower-48 dry gas production averaged 112.6 billion cubic feet per day on Friday according to BloombergNEF, up 5.2% from a year ago. Demand in the lower 48 averaged 77.7 billion cubic feet per day, barely above year-ago levels. The supply side is growing and the demand side is flat. That math does not work for the bulls.
The EIA raised its 2026 U.S. dry gas production forecast earlier this week to 111.2 billion cubic feet per day, slightly above its previous estimate. Baker Hughes reported the active natural gas rig count held steady at 126 for the week, below the February high of 134 but still at levels that keep output near record territory. The rigs are not leaving the field fast enough to tighten supply and the EIA just told you production is going higher not lower.
Ras Laffan Damage Keeps the LNG Floor in Place
The one thing holding a floor under this market long-term is the damage to Qatar’s Ras Laffan Industrial City. Qatar said attacks earlier this year knocked out roughly 17% of the facility’s LNG export capacity and repairs are expected to take several years. That is roughly one-fifth of global LNG supply running at reduced capacity with no quick fix.
LNG flows to U.S. export terminals averaged 18.2 billion cubic feet per day on Friday, down 5.2% from the previous week. The flows slipped but the structural story has not changed. As long as Ras Laffan is running below capacity, demand for U.S. LNG cargoes has a longer-term bid underneath it. That is not saving the front month from selling off on weather but it is the reason gas has a floor somewhere even if the bears are in control of the near-term trade.
El Niño Forecast Takes the Winter Bid Off the Table
NOAA expects El Niño conditions to strengthen into the Northern Hemisphere winter with a 63% chance of a very strong event between November and January. A strong El Niño winter means warmer temperatures across the northern United States and that takes a chunk of heating demand off the table before the season even starts. Some traders are already pricing that in and it adds another bearish layer to a market that did not need one.
The Edison Electric Institute reported U.S. electricity output rose 7.73% year-over-year for the week ending July 4. That sounds supportive until you check it against the production and storage numbers. Electricity demand is growing but it is not growing fast enough to absorb the supply that keeps building.
What to Watch
Next week’s storage report and the updated weather forecasts are the two things that matter for gas right now. The market broke below $3 on Friday and held the session low at $2.874 by the close. If the weather models stay cool and the next storage build comes in at or above expectations, buyers have not shown any interest in stepping in ahead of support. The El Niño forecast adds a longer-term ceiling on any rally attempt by keeping the winter demand outlook soft before the season arrives.
Retracements into the 50% to 61.8% zone of the new short-term range will test whether sellers are still in control. The only structural bull case is Ras Laffan and that is a slow-burn story that plays out over years, not weeks. Right now the weather and the production data are running the market and both are pointing the same direction.
More Information in our Economic Calendar.