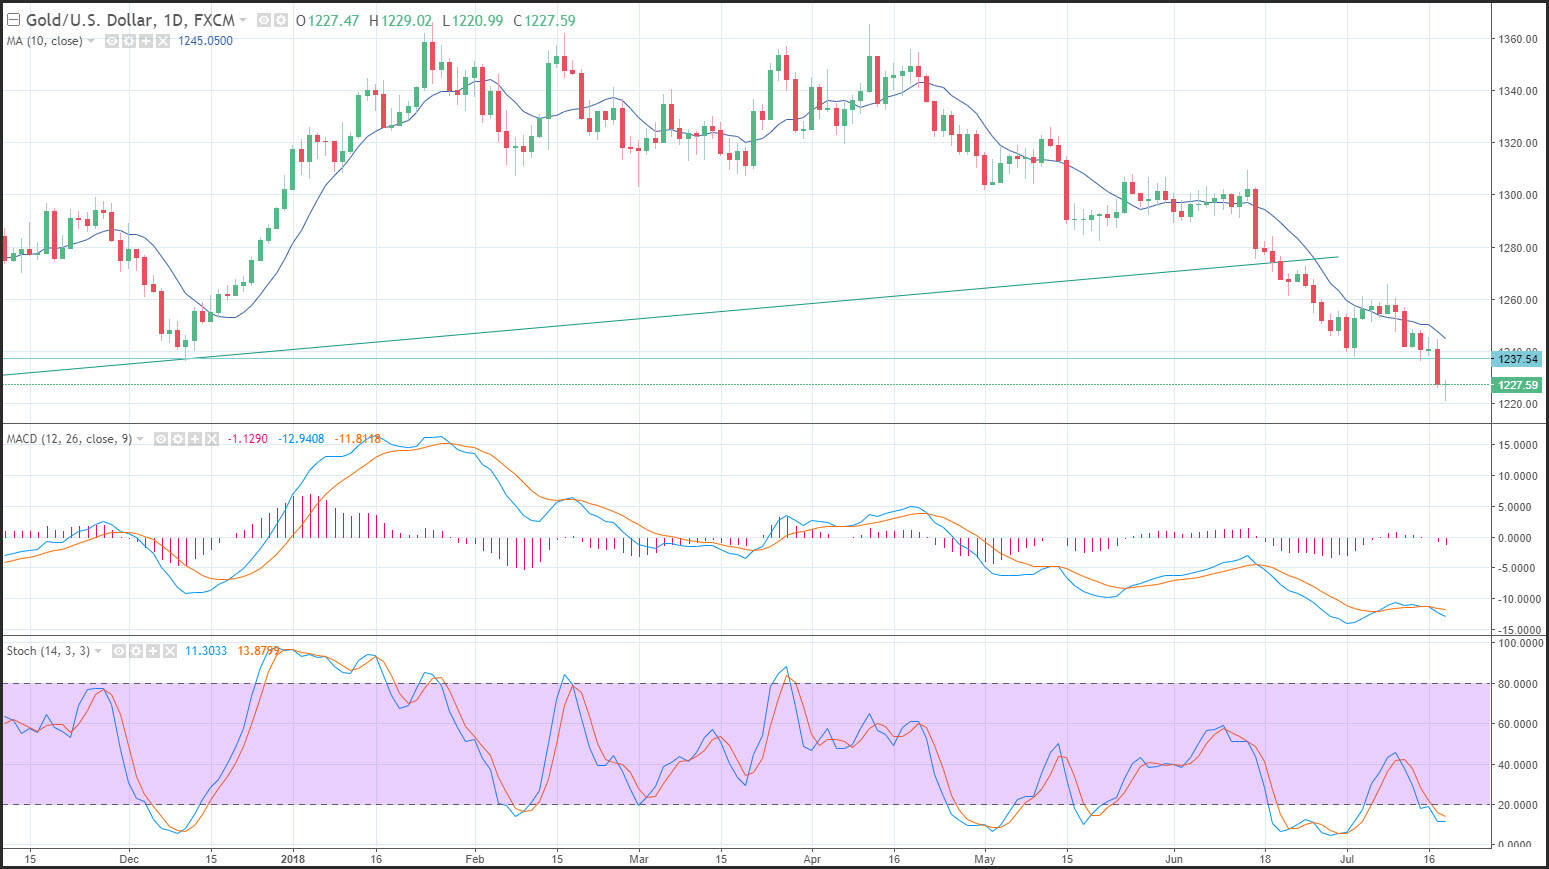
Gold prices rebounded from session lows following the softer than expected U.S. housing starts data which knocked down the dollar and paved the way for a rebound in the yellow metal. Gold prices formed a doji day with a long tail, which is generally a sign of indecision, but the rebound shows the rejection of lower prices. Target support is seen near the July 2017 lows at 1,204. Resistance is seen near the 10-day moving average at 1,245. Momentum remains negative as the MACD line recently generated a crossover sell signal and the MACD histogram is printing in the red with a downward sloping trajectory which points to lower prices. Short-term gold is oversold as the fast stochastic is printing a reading of 11, below the oversold trigger level of 20, which could foreshadow a recession.

U.S. housing starts plunged
U.S. housing starts plunged 12.3% to 1.173 million in June after rising 4.8% to 1.337 million in May which was revised form 1.350 million and April was bumped down to 1.276 million from 1.286 million. Expectations were for a flat reading. June single family starts dropped 9.1% versus the 5.1% prior increase with multifamily starts sliding 19.8% from 4.0%. Building permits declined 2.2% to 1.273 million following the 4.6% drop to 1.301 million previously. Starts have contracted at a -4.2% year over year versus 19.2% year over year. Sales declined in all four regions surveyed, led by a 35.8% drop in the Midwest.
Eurozone HICP inflation was confirmed
Eurozone HICP inflation was confirmed at 2.0% year over year with the final June reading, as expected. The uptick from 1.9% year over year in May was largely due to higher energy price inflation, which accelerated to 8.0% year over year from 6.1% year over year. Excluding energy the rate declined to 1.3% year over year from 1.4% year over year and core inflation actually fell back to 0.9% year over year from 1.1% year over year in May and versus 1.0% year over year in the preliminary reading. Services price inflation fell back to 1.3% year over year from 1.6% year over year.