Gold markets fell during the session on Tuesday, testing the bottom of the hammer from the Monday session. This is a very negative sign, but I think that
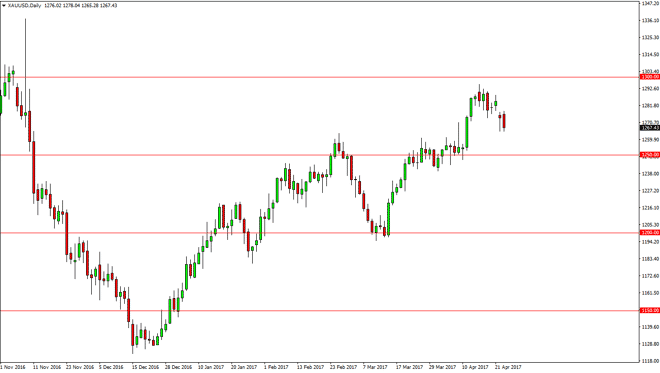
Gold markets fell during the session on Tuesday, testing the bottom of the hammer from the Monday session. This is a very negative sign, but I think that there is a massive amount of support just below, and especially at the $1250 level. I think a pullback to that area could end up being a nice buying opportunity in an uptrend. I’m looking for support of candles or bounces or something like that to start going long again and have no interest in shorting gold. There is far too much in the way of geopolitical risk right now to think the gold’s going to fall for any great length of time.
Chris is a proprietary trader with more than 20 years of experience across various markets, including currencies, indices and commodities. As a senior analyst at FXEmpire since the website’s early days, he offers readers advanced market perspectives to navigate today’s financial landscape with confidence.