Gold markets initially fell during the day on Wednesday, but found the 100-day exponential moving average to be supportive enough to keep the market
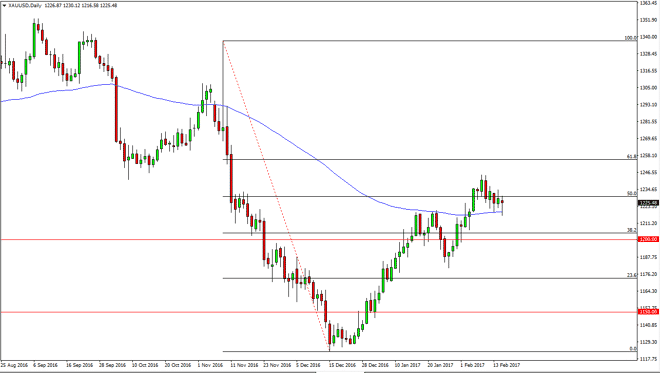
Gold markets initially fell during the day on Wednesday, but found the 100-day exponential moving average to be supportive enough to keep the market afloat. If we can break above the top of the candle for the day, we should then reach towards the $1250 level. I believe that this market has plenty of support all the way down to the $1200 level, so I have no interest in shorting. We are currently hovering the 50% Fibonacci retracement level, and thus it’s likely that the market will see participants interested in both directions.
Chris is a proprietary trader with more than 20 years of experience across various markets, including currencies, indices and commodities. As a senior analyst at FXEmpire since the website’s early days, he offers readers advanced market perspectives to navigate today’s financial landscape with confidence.