Gold markets fell slightly on Wednesday, testing the resistance barrier that we’ve been dealing with. Ultimately, there is a line of noise all the way to
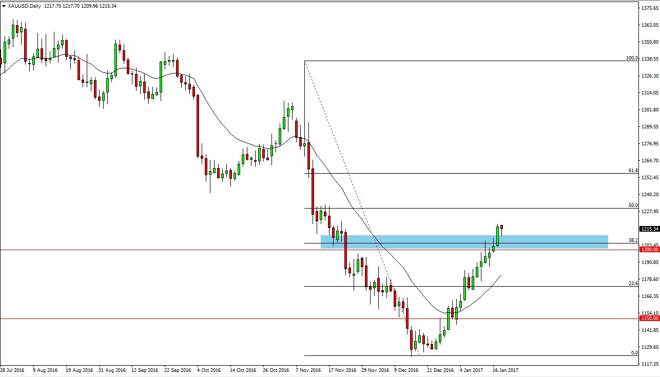
Gold markets fell slightly on Wednesday, testing the resistance barrier that we’ve been dealing with. Ultimately, there is a line of noise all the way to the 50% Fibonacci retracement level, which is at the $1230 level. If we can break down below the $1200 level underneath, it’s time to start selling as it would be a continuation of the negativity. In the meantime, the one thing you probably can count on is going to be volatility. Pay attention to the US dollar, it has a lot of influence on the gold market.
Chris is a proprietary trader with more than 20 years of experience across various markets, including currencies, indices and commodities. As a senior analyst at FXEmpire since the website’s early days, he offers readers advanced market perspectives to navigate today’s financial landscape with confidence.