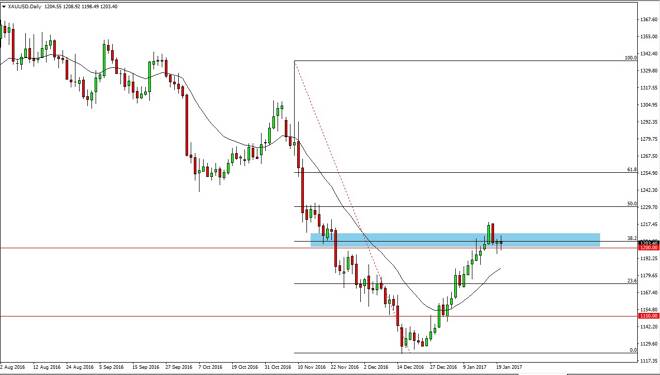
Gold markets fell after initially trying to rally on Friday, as we continue to bounce around the $1200 level. The 38.2% Fibonacci retracement level
Gold markets fell after initially trying to rally on Friday, as we continue to bounce around the $1200 level. The 38.2% Fibonacci retracement level continues to offer quite a bit of volatility as well, but I think more importantly we have formed a shooting star on the weekly chart, and a breakdown below the $1200 level should send this market much lower. If we can break out and to a fresh, new high, the market should then reach towards the $1230 level which is the 50% Fibonacci retracement level. A strengthening US dollar continues to work against the market.
Chris is a proprietary trader with more than 20 years of experience across various markets, including currencies, indices and commodities. As a senior analyst at FXEmpire since the website’s early days, he offers readers advanced market perspectives to navigate today’s financial landscape with confidence.