Bearish Correction Deepens
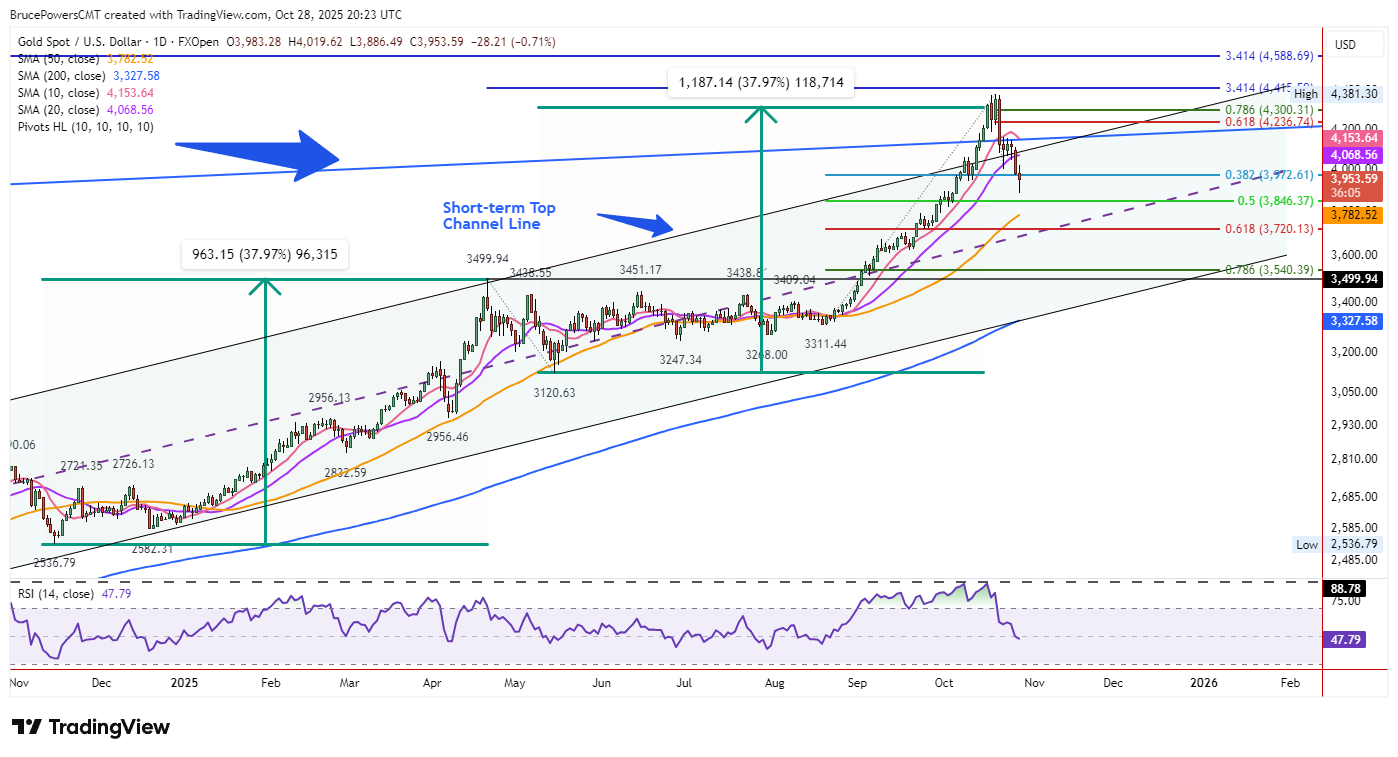
Gold extended its bearish correction on Tuesday, carving a new pullback low before support kicked in. An intraday bounce lifted prices into the top half of the range, setting up a potential bull hammer candlestick. While this may spark short-term strength, the trajectory points to the 50% retracement as a likely downside target before the pullback wraps, if not lower.

Resistance on Rebound
A rally above today’s high could test the 20-day average at $4,068, the first resistance after Monday’s breakdown. Yesterday’s 38.2% Fibonacci retracement support failed at $3,971, shifting focus to the 50% level. The 10-week average aligns nearby, adding weight to this zone.
Channel and Support Targets
Monday’s drop breached the 20-day average and top short-term rising channel line, suggesting a test of the channel centerline. This supports a potential move to the 50-day average at $3,783, above the centerline, indicating a longer correction—either lower or sideways.
Weekly and Monthly Context
This week’s break below prior lows marks the first weekly pullback in the trend in nine weeks, with crude rapidly approaching the four-week low. Prior corrections lasted two to four weeks. On the monthly chart, sustained pressure through Friday risks a shooting star pattern if prices eventually drop below this month’s low after the month ends.
Outlook
The daily bull hammer offers short-term hope, but $4,068 resistance caps bounces. A close below recent lows targets the 50% retracement and centerline. Watch channel dynamics—support there could pause the slide, but a 50-day test signals deeper correction. Today’s close will clarify if bulls regroup or bears press on.
Gold Price Forecast
Every new Gold analysis as it publishes, today's technical signal and key levels, live price — on one page.
See all Gold forecastsIf you’d like to know more about how to trade precious metals, please visit our educational area.