Gold Tests Resistance At $4530 – $4550
Gold gains ground as traders focus on Trump’s comments on Iran. He said that he would make “final determination” on Iran truce soon.
Oil prices moved lower as traders bet that U.S. and Iran will reach a deal soon. WTI oil pulled back below the $87.00 level, while Brent oil settled below $91.00. Falling oil prices provided material support to gold markets.
President Trump said that Iran must agree to never have a nuclear weapon and that the enriched material would be unearthed by the United States. Iranian media reported that the sides did not discuss Iran’s nuclear program and worked on other issues.
As usual, the sides of negotiations present different stories, which is typical for complicated negotiations. That said, global markets believe that U.S. and Iran are moving towards a deal, which could be announced soon.
Treasury yields pulled back as bond traders focused on falling oil prices. The yield of 2-year Treasuries declined towards the 4.00% level, while the yield of 10-year Treasuries settled near 4.45%. Falling Treasury yields provided material support to gold markets.
U.S. dollar moved lower against a broad basket of currencies as demand for safe-haven assets declined. Weaker dollar is bullish for dollar-denominated commodities as it makes them cheaper for buyers who have other currencies.
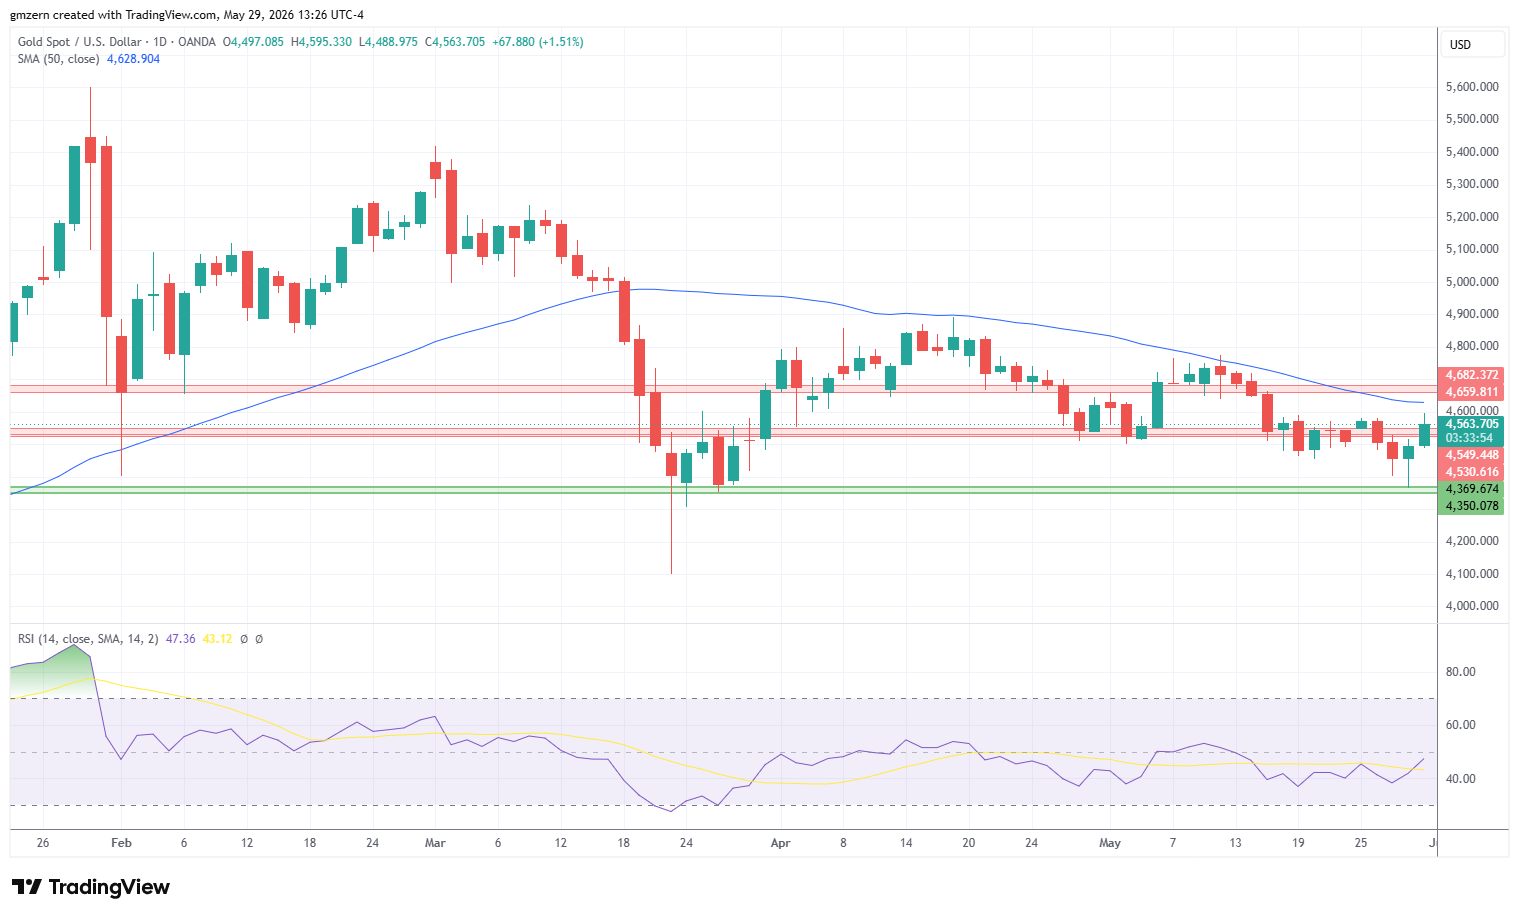
Currently, gold is trying to settle above the resistance level at $4530 – $4550. This resistance level has already been tested many times and proved its strength. In case gold climbs above the $4550 level, it will head towards the next resistance, which is located in the $4660 – $4680 range.

Silver Is Flat As Gold/Silver Ratio Climbs Above 60
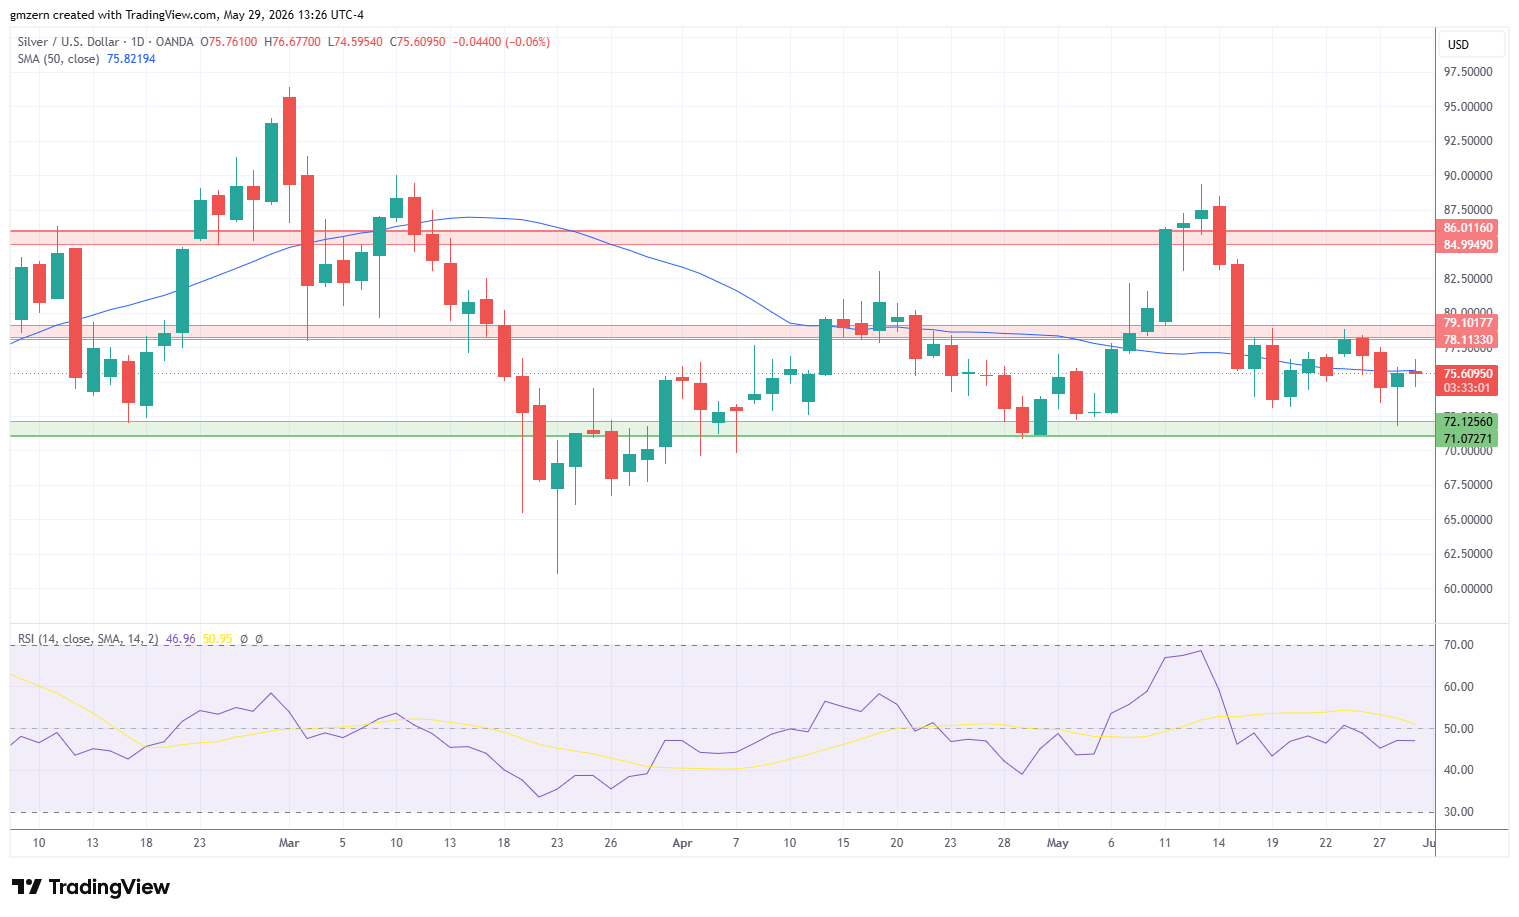
Silver is mostly flat as gold/silver ratio climbed above the psychologically important 60.00 level. In case gold/silver ratio settles above 60, it will head towards the 50 MA at 61.11, which will be bearish for silver.
From the technical point of view, silver continues its attempts to settle above the 50 MA at $75.81. If silver settles above the 50 MA, it will head towards the resistance level, which is located in the $78.00 – $79.00 range. A successful test of the resistance at $78.00 – $79.00 will open the way to the test of the next resistance at $85.00 – $86.00.
On the support side, a move below the $75.00 level will push silver towards the support level at $71.00 – $72.00.
Gold Price Forecast
Every new Gold analysis as it publishes, today's technical signal and key levels, live price — on one page.
See all Gold forecastsPlatinum Remains Stuck Near The $1900 Level
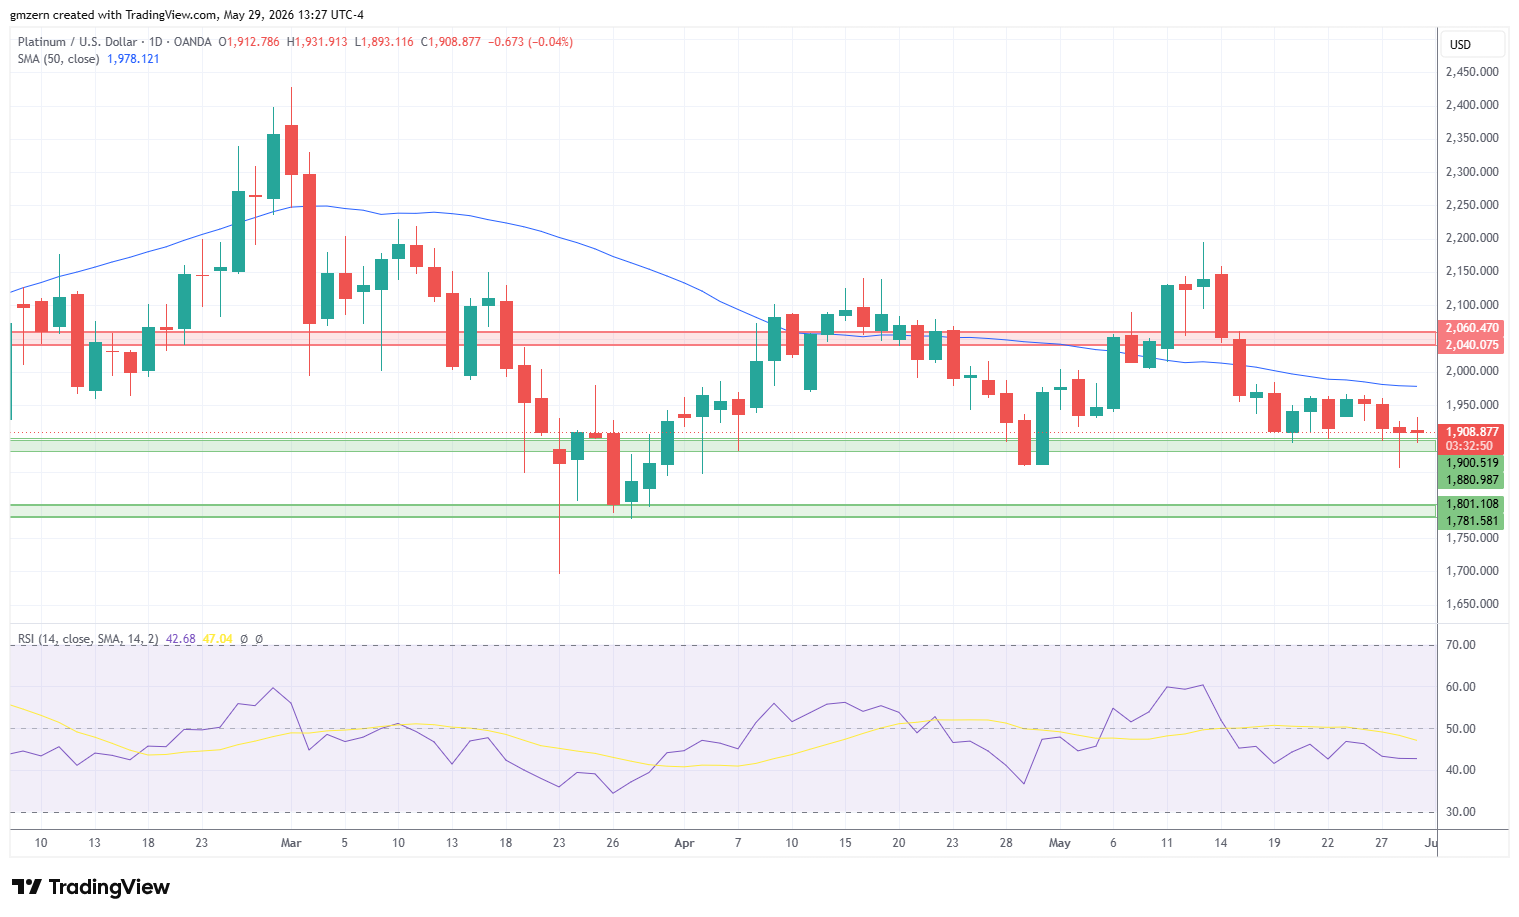
Platinum is losing some ground despite the strong pullback in the oil markets. It looks that traders are worried about long-term damage to global economy due to high oil prices. Palladium markets are down by -1.5%, which is bearish for platinum.
Platinum remains stuck near the support level at $1880 – $1900. If platinum manages to settle below the $1880 level, it will head towards the next support at $1780 – $1800.
On the upside, a move above the $1950 level will push platinum towards the 50 MA at $1978. If platinum climbs above the 50 MA, it will head towards the nearest resistance level at $2040 – $2060.
If you’d like to know more about how to trade gold and silver, please visit our educational area.