
Gold and Silver Consolidate as Inflation Data and Ceasefire Stability Shape Outlook
Gold and silver were somewhat indecisive today in May 27, 2026 trading as investors focused more so on hotter than expected U.S. April inflation data coming last month as well as stability of the interim U.S.-Iran cease-fire. The Consumer Price Index data for April, the headline and core were well above forecasts. As a result of the data, expectations of short-term rate cuts of Chair Warsh and the Federal Reserve are dampened supporting the real yield and the dollar at the cost of gold and silver.
Gold is supported by solid central bank purchases and, the People’s Bank of China in particular is in its more than 17th consecutive monthly buy today. As the geopolitical premium has faded, central bank purchases has been one of the key drivers for the precious metal. Silver is currently trying to juggle weakening safe-haven flows with strong industrial demand in support of the current market deficit.
Weaker energy prices have had a marginal reduction in hedging inflation gold and silver demand but have been a net positive for the metal’s industrial sectors such as solar, electric vehicles, electronics and semiconductors, and AI. Given the ceasefire is in place and normalization of oil trade continues, it will be interesting to see the metals trade past the immediate headlines toward a more normal fundamental regime. This week is also important as investors are waiting for further Federal Reserve comments.

Gold Spot Tumbles Under $4,500 After Descending Channel Breakdown
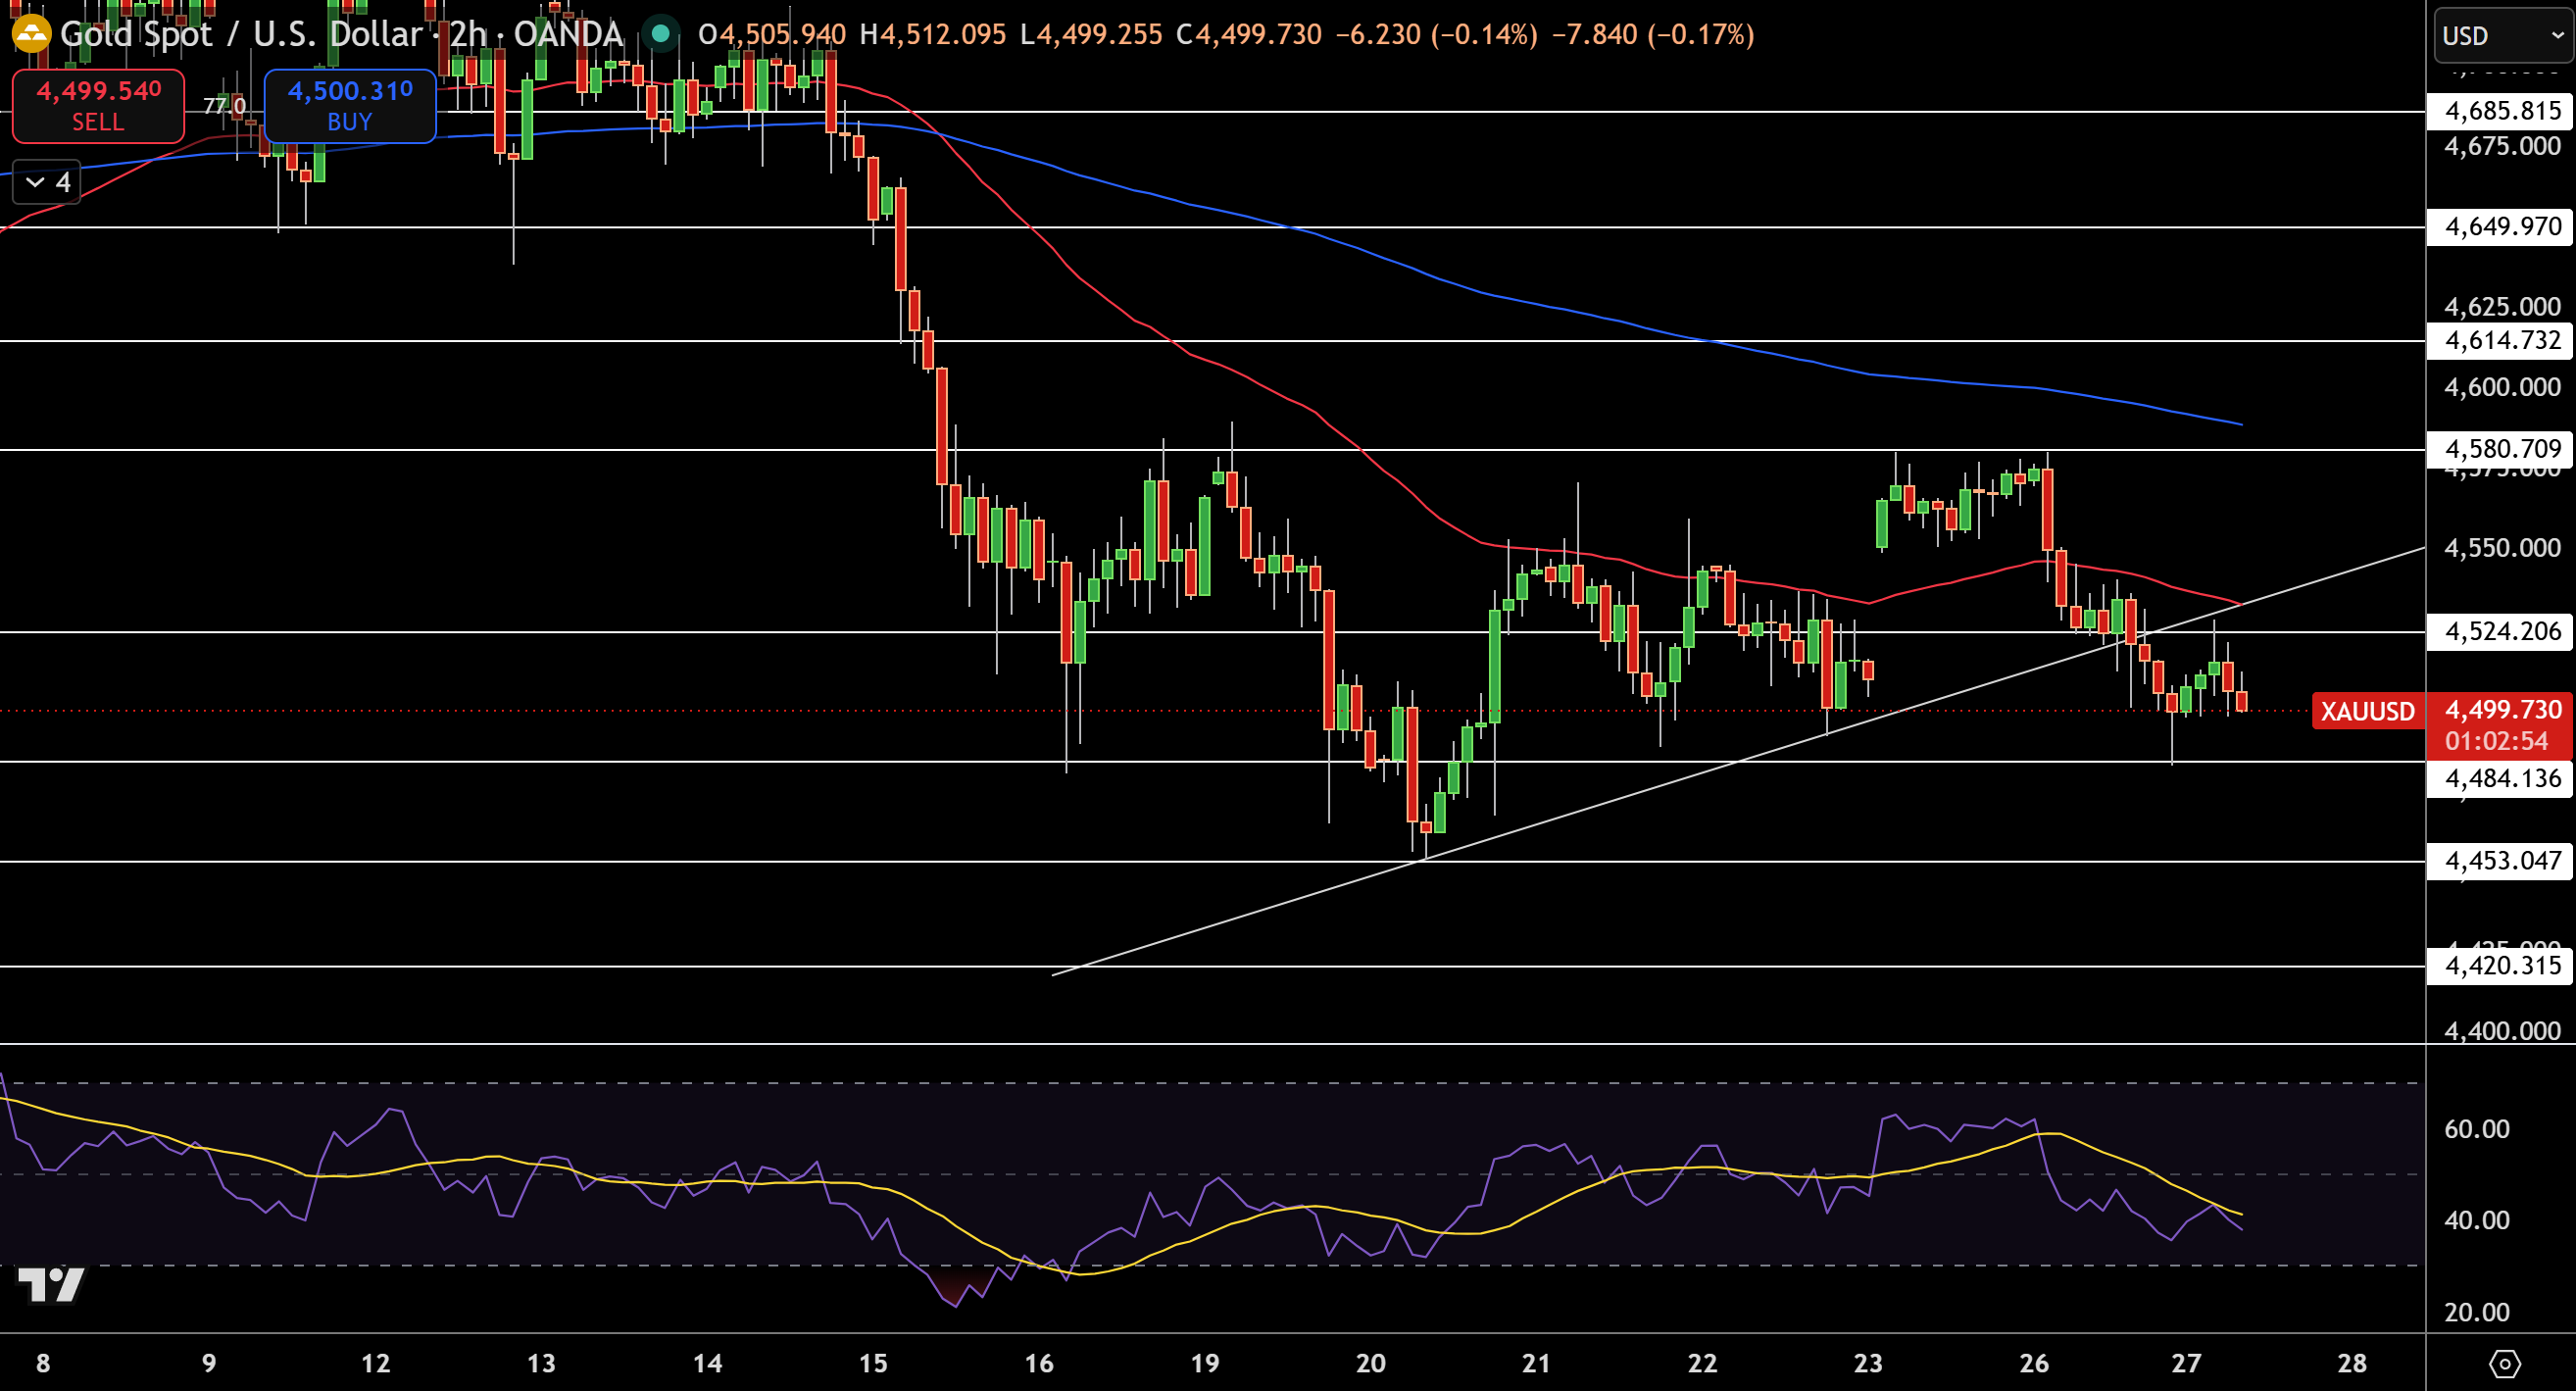
Gold now sits at $4,499.73 on 2h chart after recent red candle engulfment pushed price below the blue trend channel floor near $4,512. The red 50-period MA is now located just below this key support zone as well as the $4,523 pivot. Price has now fully broken down the channel floor.
Price action is still trending bearish from the $4,600 range high, where distribution is accelerating in a series of lower lows that have not been invalidated yet. The next targets are in the Fib extension zone at $4,484 to $4,453. Relative strength index (RSI) has recently broken down through the 45 level. No oversold rebound has occurred to confirm trend reversal.
Volume profile marks $4,538 to $4,546 as failed fair value with sellers dominating. The white trend line is a descending channel which may cap any recovery near $4,573. Structure has remained bearish below the $4,523 pivot zone and price has moved down the trend inside the channel from the highs in May.
Trade Idea: Sell $4,499 with a target for $4,453, and a stop for $4,523.
Gold Price Forecast
Every new Gold analysis as it publishes, today's technical signal and key levels, live price — on one page.
See all Gold forecastsSilver Spot Dips to $76.59 After Trendline Support Test
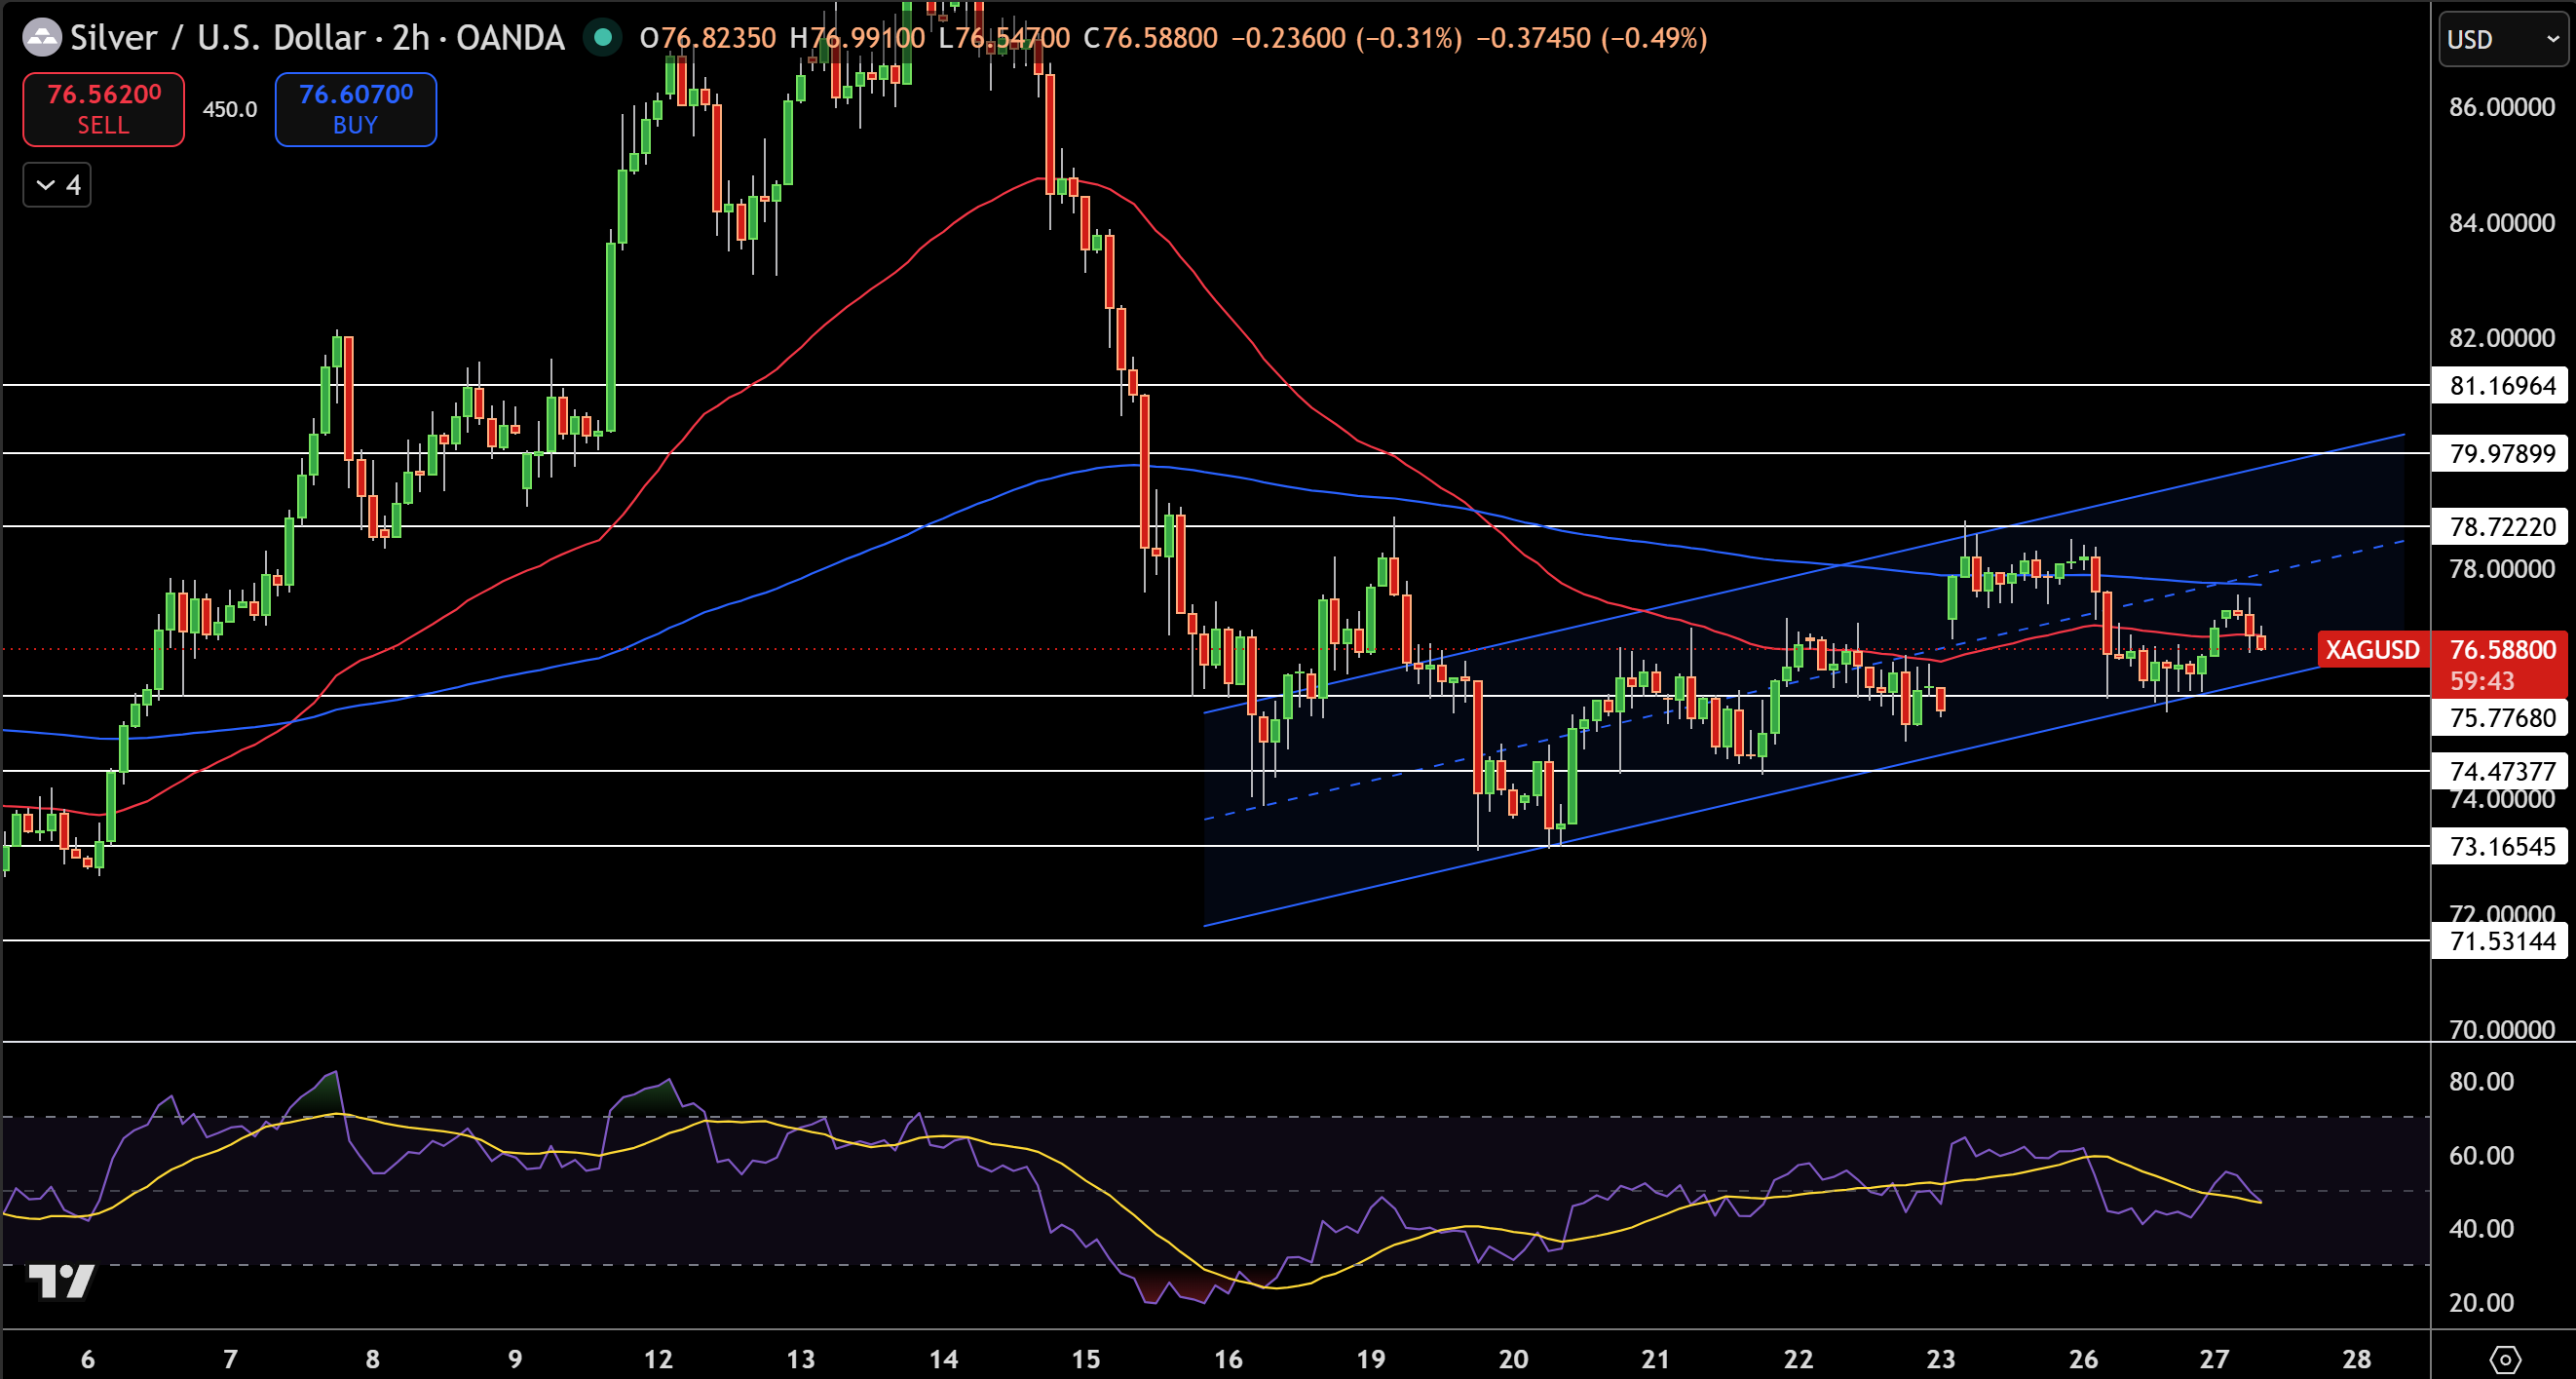
Silver now trades at $76.59 on a 2 hour time frame after recent candles selling into the red moving average near $77.75 which tested the blue trend line which is ascending. This price action has printed a series of lower highs in a bearish wick pattern as distribution is still occurring from the $78.92 range high which still holds over the minor pivot at $76.00.
The relative strength index (RSI) is hovering near the 48 level and still maintaining a near-neutral to bearish momentum. The $76.50 to $77.00 price range has shown heavy supply on the volume profile. A retest of the $75.78 to $74.69 range is in the Fib confluence for a target.
Structure is weakening below the $77.75 pivot level while price action remains testing the trendline support of an ascending channel within a larger descending channel.
Trade Idea: Sell $76.59 with a target of $75.78, and a stop for $77.00.