


GS Technical Analysis
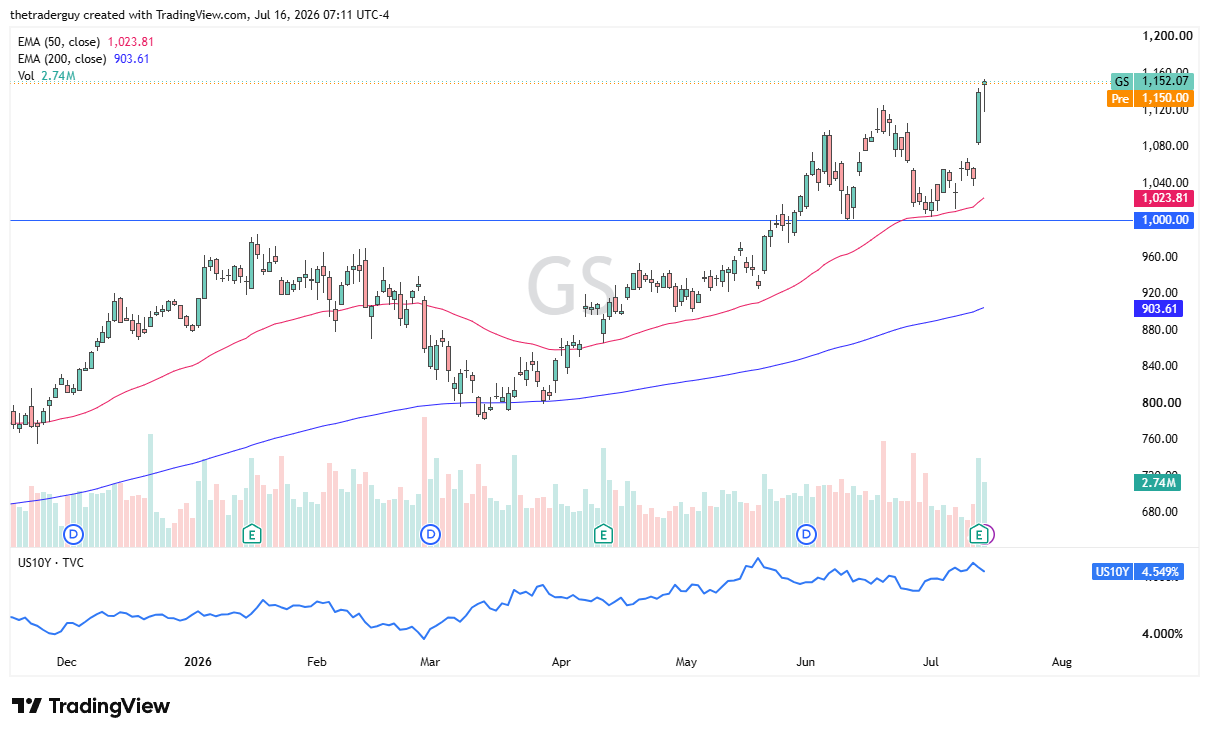
Goldman Sachs looks like it’s going to open up pretty much where it closed, as we continue to see momentum in the market after stronger-than-anticipated earnings, and of course, the whole idea with interest rate markets offering plenty of trading opportunities for those active desks out there. It does make sense that Goldman would continue to be a major victor here.
Short-term pullbacks have been bought into, and this is a market that is very much in an uptrend and continues to look very strong. It is very difficult to consider shorting it at this point in time. One would have to believe that if we do, in fact, get some type of pullback, it should offer value.
C Technical Analysis
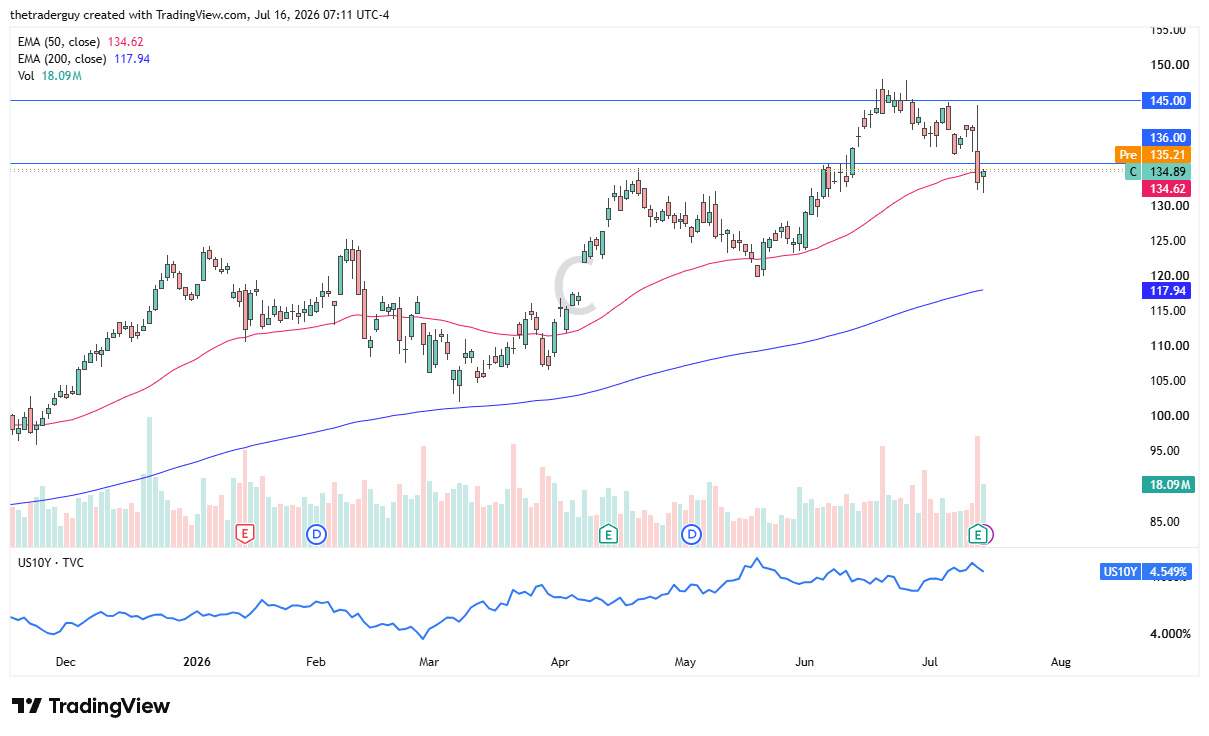
Citigroup looks like it’s going to open a little higher as we hang around the 50-day EMA. There were some comments during the earnings call a couple of days ago that really shook this market, but stabilizing during the Wednesday session and perhaps rising on Thursday could be a good sign. So, I think some people will be watching this as a potential opportunity to get into the overall uptrend that has been in effect for quite some time.
The $145 level above had offered resistance. Buyers could be looking to get there. If we break down below the bottom of the candlestick from Wednesday, that obviously would be a sign that the sellers have returned and could be very negative.
JPM Technical Analysis
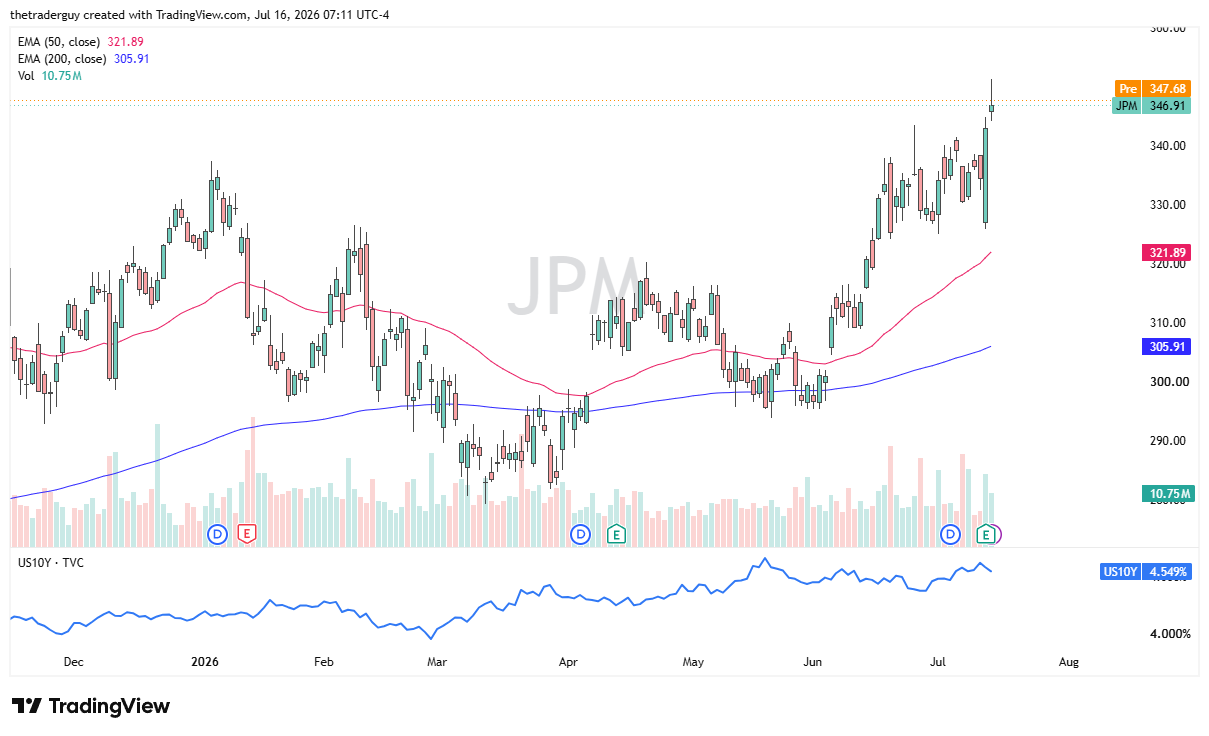
The market for JPMorgan Chase is a little bit positive at the pre-market trading despite the fact that a massive shooting star had formed during the previous session. Stronger-than-anticipated earnings coming out of JPMorgan have helped lift it as well. One has to look at this through the prism of a longer-term uptrend, and we just broke new ground, so maybe that’s some of the pushback that we got on Wednesday, just simple profit-taking.
But at this point, it certainly looks like this is a market that wants to continue to be bullish. The $350 level seems to have been a trigger for selling. It’s possible that perhaps options traders had something to do with that.
If you’d like to know more about technical analysis and how traders use it, please visit our educational area.