Chips Sell on a Beat and the Dow Takes the Lead
Semiconductor stocks are dragging the Nasdaq lower Thursday morning despite TSMC beating expectations and raising its capital spending forecast, and the selling is running through the entire chip sector globally.
The Dow is going the other direction with UnitedHealth carrying the index after clearing earnings estimates by a wide margin and raising full-year guidance.
Retail sales and weekly jobless claims are the next data points feeding into the rate repricing that started Tuesday and the numbers will either confirm the soft inflation trend or complicate it heading into the end of the week.
At 11:48 GMT, S&P 500 futures were trading at 7,599.00, down 15.75 points, or 0.21%. Nasdaq-100 futures stood at 29,466.50, down 226.75 points, or 0.76%, while Dow Jones futures traded at 53,009.00, up 109.00 points, or 0.21%.

TSMC Beat and the Chips Still Sold
TSMC cleared expectations and raised its capital spending forecast to between $60 billion and $64 billion from a previous outlook of $52 billion to $56 billion, then added another $100 billion Arizona investment on top of it. The stock fell more than 4% in pre-market trading, suggesting investors were already pricing in everything the report delivered. The shares are up roughly 38% in 2026 and Thursday’s reaction says the run needed a pause more than it needed another strong quarter.
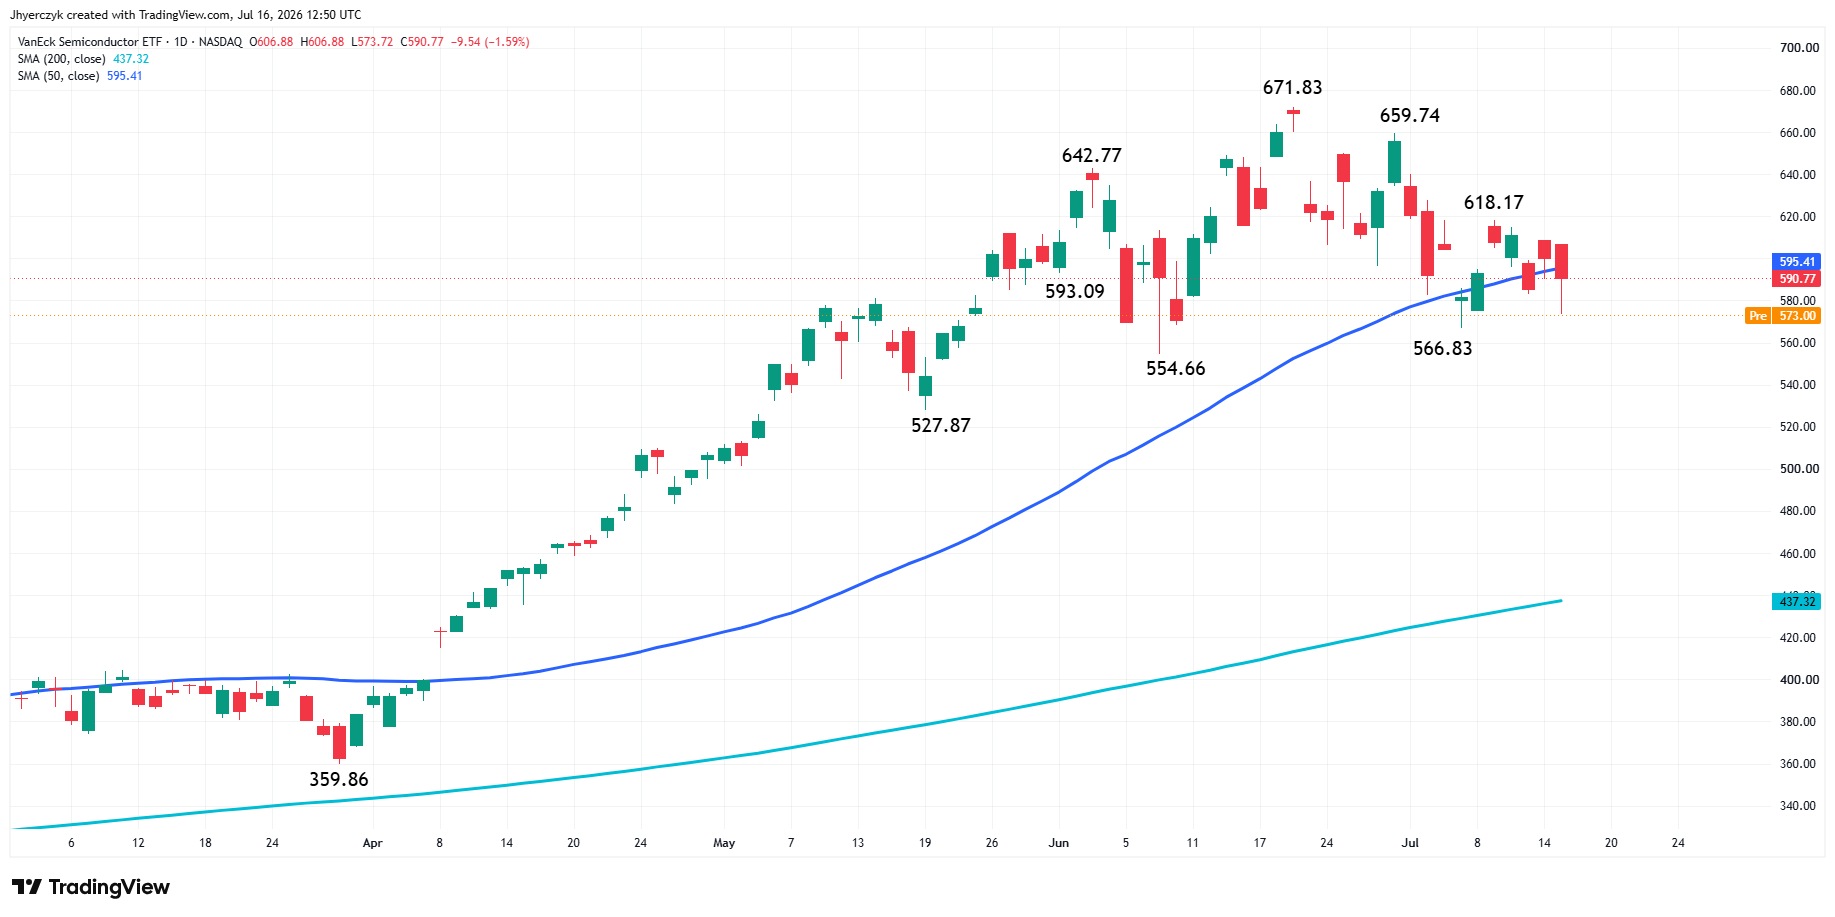
The selling did not stay with TSMC. The VanEck Semiconductor ETF dropped about 2.2% and the weakness ran through the entire supply chain from Arm Holdings in the U.S. to SK Hynix in Seoul, which plunged 11%. European chip stocks followed with broad declines Thursday morning. The sector is repricing globally on a day the fundamental news was positive, and that disconnect says this is about positioning on a crowded trade, not a shift in demand expectations.
NASDAQ 100 Price Forecast
Every new NASDAQ 100 analysis as it publishes, today's technical signal and key levels, live price — on one page.
See all NASDAQ 100 forecastsUnitedHealth Gave the Dow a Different Story
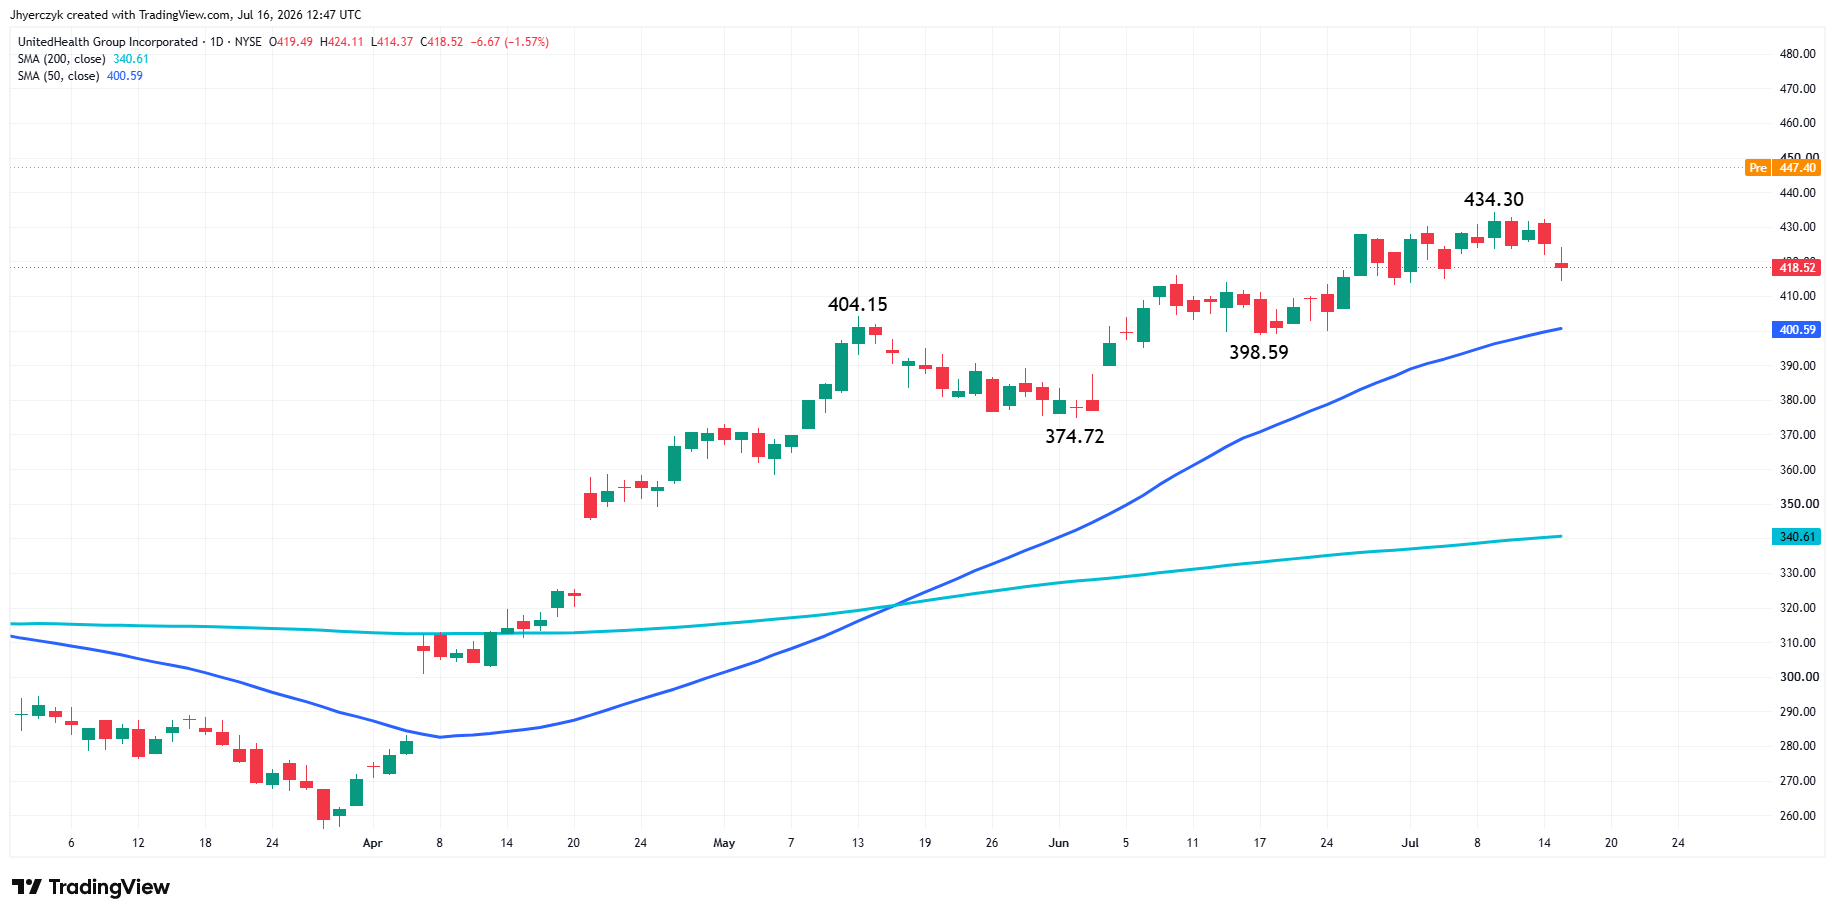
UnitedHealth climbed more than 7% and the Dow followed. That kind of reaction on a day when every other strong report is getting sold tells you the market was not positioned for what UnitedHealth delivered. The chip stocks beat and gave back gains. UnitedHealth beat and the buyers kept going. That contrast is running the entire session.
J.B. Hunt added nearly 7% on strengthening intermodal demand throughout the quarter, and the combination of healthcare and transportation leading while chips sell off is a rotation that favors the broader economy over the growth trade. The market is letting that rotation develop Thursday morning instead of fighting it.
Retail Sales and Claims Test the Rate Move
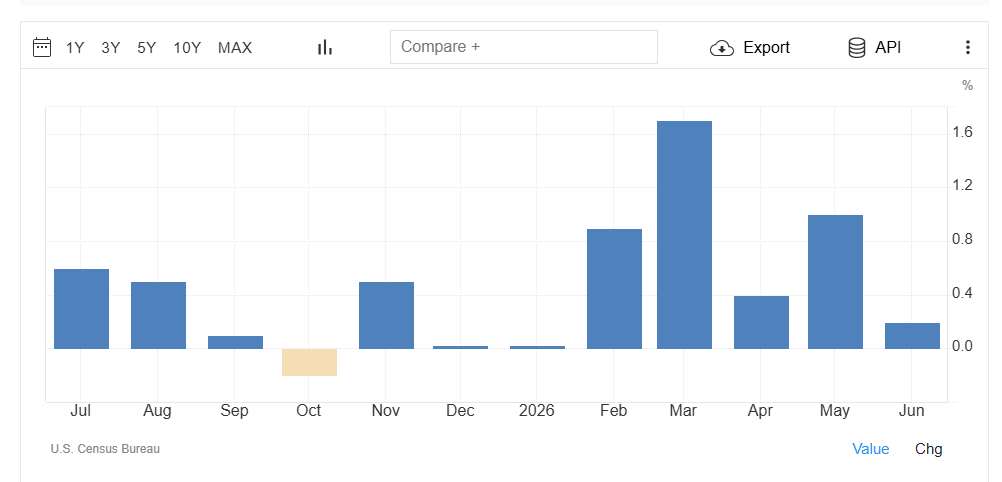
The rate repricing that started with Tuesday’s CPI and accelerated on Wednesday’s PPI gets tested again at 12:30 GMT. Hike probability dropped from 41% to 12% in two sessions, and that move needs new data to hold it. Retail sales and jobless claims are the next two inputs and the market needs both to keep confirming the same direction.
The broadening this market needs requires rates to cooperate. If rates stay flat or drift lower, the rotation into healthcare and transport Thursday morning can become a trend. If they climb back, that rotation is a one-day trade. Sluggish employment data would help keep a ceiling on rates and that makes the claims number Thursday almost as important as the retail sales headline.
Stocks in the News
GE Aerospace pulled back about 4% Thursday morning, and beating on both lines while raising guidance did not change the mood on a stock that investors already bid up heading into the print. The stock ran too far into the print and the numbers were not enough to justify paying up again.
United Airlines fell more than 3% with management warning that roughly $6 billion in additional fuel costs are running through the forward outlook while crude keeps climbing on Middle East supply risk. The third-quarter guidance came in light and the fuel warning gave sellers all the reason they needed.
Eli Lilly agreed to acquire AtaiBeckley for $2.8 billion with additional milestone payments, sending the psychedelic drug developer up more than 34%.
Uber edged higher after agreeing to acquire Delivery Hero in a deal valuing the German company at $14.8 billion.
Netflix reports after the close and the reaction will set the tone heading into Friday.
Daily September E-mini Nasdaq-100 Index Futures
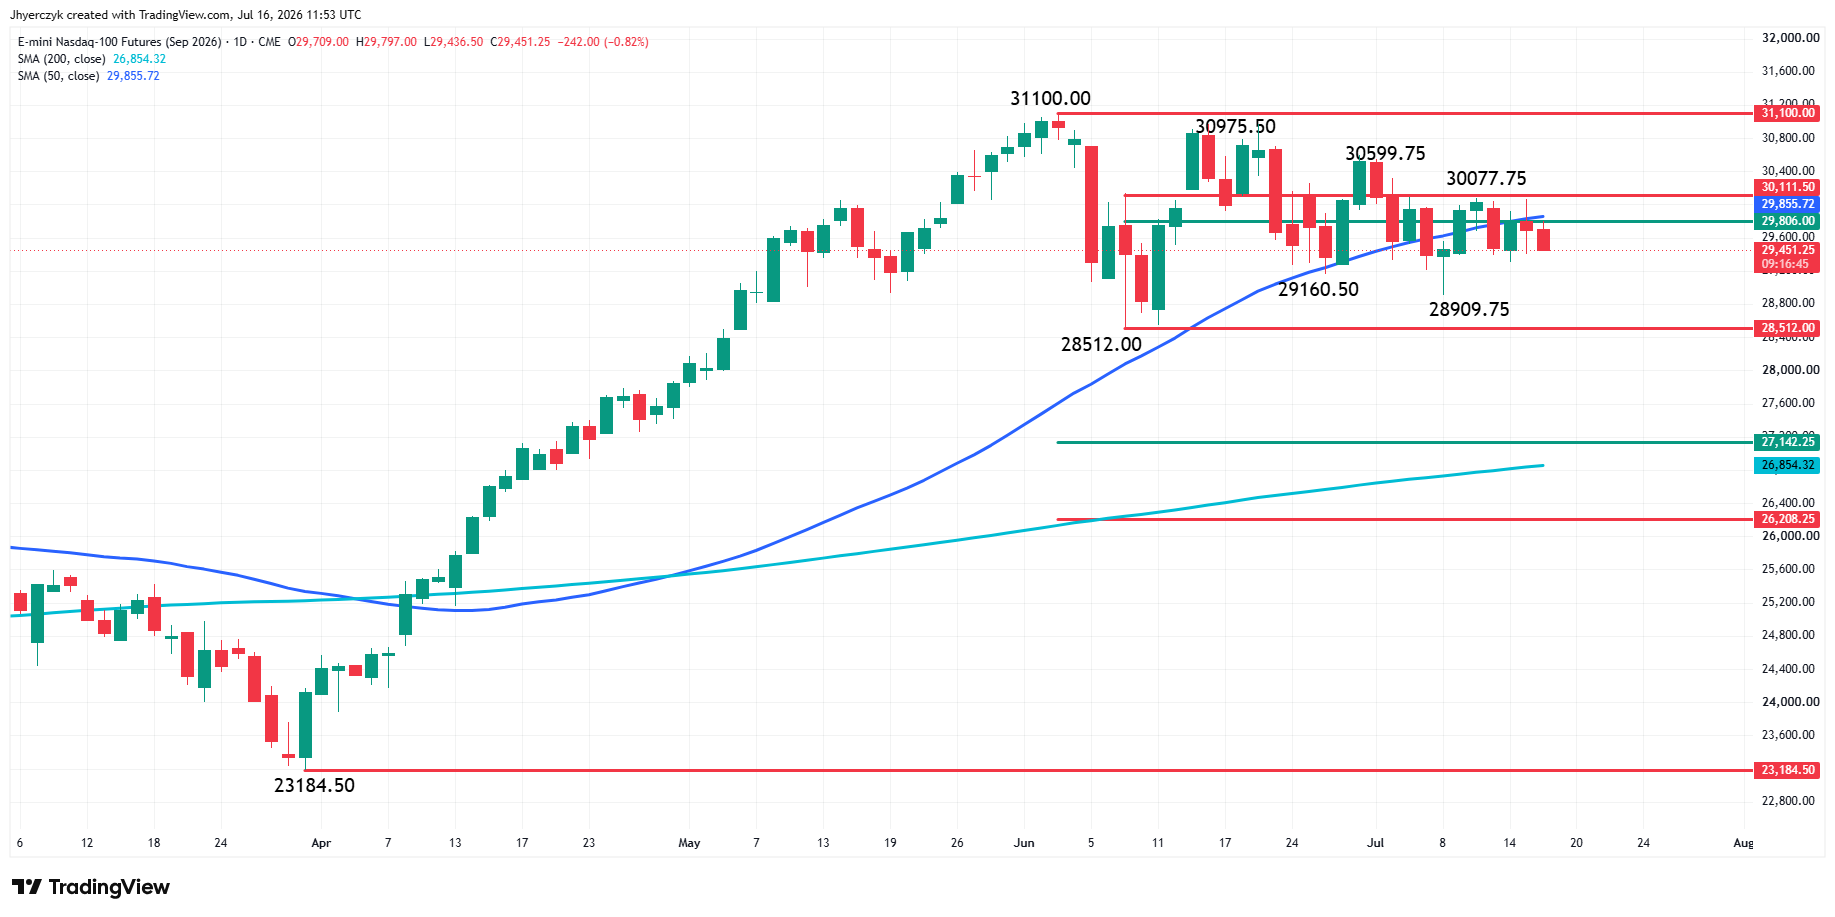
Daily September E-mini Nasdaq-100 Index Futures is the market to watch on the opening if the pre-market activity is any indication. The tech-driven futures contract is trading on the weak side of its 50-day moving average at 29855.48 as well as the bearish side of a short-term retracement zone at 29806 to 30111.50. The latter has been a major headache for bullish traders looking to extend the rally since July 2. Is this the set-up that finally triggers the rollover to the downside? We could get an indication today if sellers are able to take out 29303.50 with conviction.
A decisive trade through 29303.50 could solidify the loss for the week, and trigger the start of an even steeper break into the swing bottom at 28909.75. However, I think the true trigger point for an acceleration to the downside is the June 9 bottom at 28512.00. This point on the chart is the last support before the long-term retracement zone at 27142.25 to 26208.25 and the 200-day moving average at 26854.17.
Daily Nasdaq Composite (IXIC) Technical Analysis
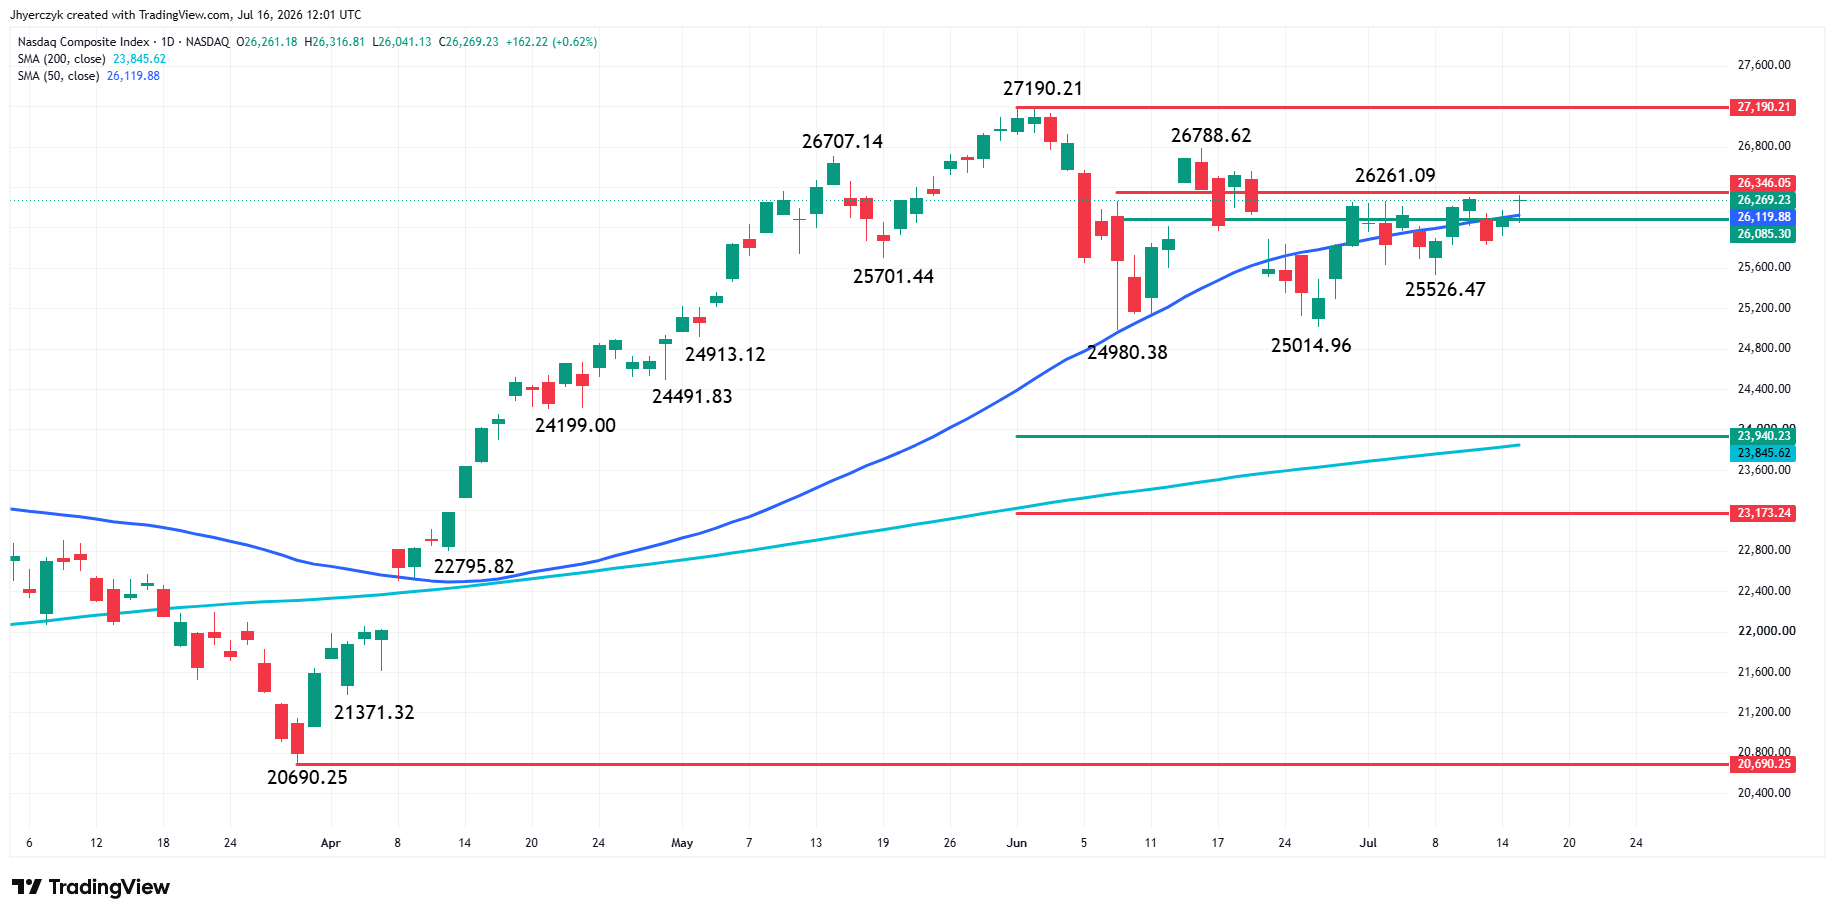
Yesterday, the Nasdaq Composite cash index settled on the strong side of its 50-day moving average at 26119.88 and inside its short-term retracement zone at 26085.30 to 26346.05. The tone of the market today will be determined by how it handles this zone and the potentially bearish set-up in the futures market.
On the downside, gapping below 26085.30 will put it on the weak side of both the 50-day moving average and the short-term 50% level. Follow-through selling will put the swing bottom at 25526.47 on the radar. If this fails then 25014.96 and 24980.38 are next.
For both the futures and the cash market, the 50-day moving average is the key indicator to watch. This is because it tends to be followed by more major players than short-term retracement zones. Trader reaction to the 50-day moving average will set the tone today.
What to Watch
Retail sales and jobless claims at 12:30 GMT are the session’s catalysts and both feed into a rate repricing that has moved fast enough in two days to need confirmation. The chip selloff is happening on positive fundamental news, which means the sector is working through positioning, not a change in the demand picture. The rotation into healthcare and transport is the story Thursday morning and whether it holds depends on whether the economic data supports the rate outlook that made it possible.
The Nasdaq-100 futures are trading on the weak side of the 50-day moving average and the cash index settled right at the edge of its retracement zone Wednesday. A break below 29303.50 in the futures could trigger a steeper leg lower, but the 50-day moving average is where the bigger players are making their decisions. Thursday’s data and the Netflix report after the close will determine whether the index holds above that level or the sellers take control heading into Friday.
More Information in our Economic Calendar.