Solana (SOL) has gone down by nearly 2% in the past 24 hours as the token continues to struggle to clear a key resistance area at $78 despite the latest rally.
Trading volumes have retreated recently, dropping from a near-term peak of $4 billion on July 2 to $2 billion as of yesterday.
A temporary boost driven by a lower-than-expected inflation print in the United States this week did little to push SOL above that $78 ceiling, and this early rejection could be a sign that buying interest has weakened.
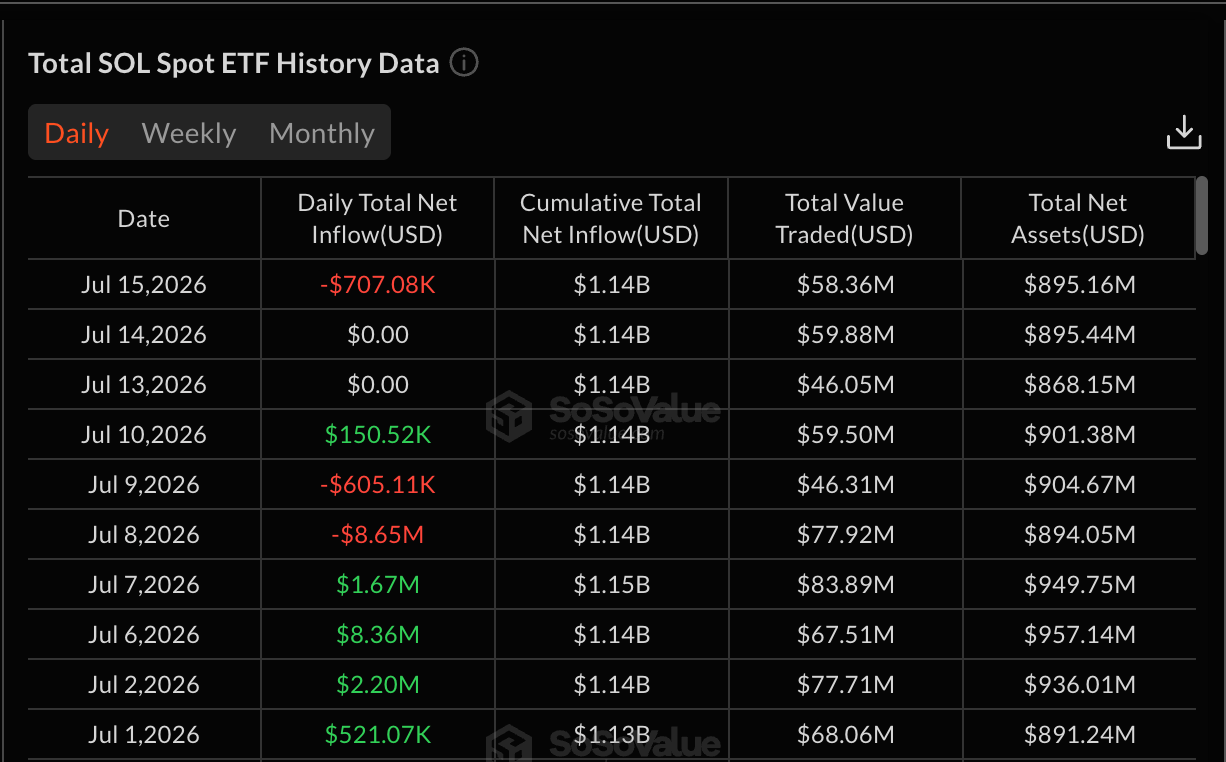
This week, net inflows to exchange-traded funds (ETFs) linked to Solana have turned negative, with $700,000 already moving out of these vehicles.
This implies a departure from recent weekly trends, as SOL ETFs brought in over $1.1 million the week before and nearly $3 million since the month started.
Investors’ sentiment toward altcoins is still volatile as macroeconomic conditions are not the best.
The Federal Reserve is still expected to raise rates by September despite inflation cooling down, and that sets the stage for a prolonged consolidation or for the continuation of the current downtrend if key levels are broken.

Daily Active Addresses Keep Rising as Market Participants Position for Solana’s Next Move
We recently warned that on-chain data provides evidence that investors are positioning for Solana’s next big move.
Transaction volumes spiked to a new all-time high two weeks ago, while weekly active users have been steadily climbing.
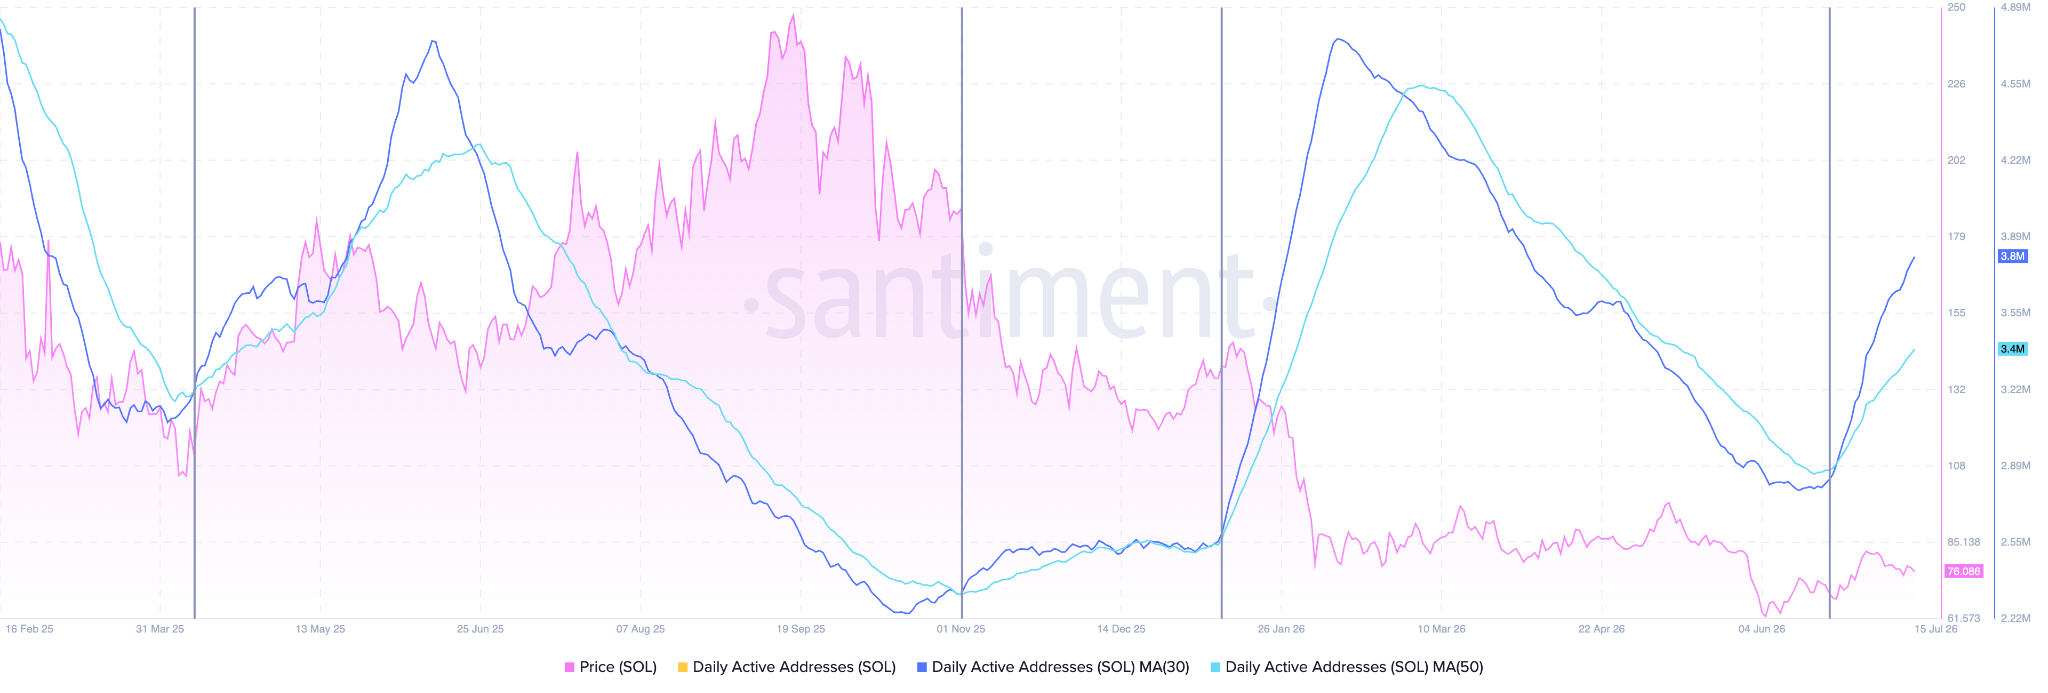
One specific data point, the moving averages (MA) for daily active addresses (DAAs), confirms this trend. According to data from Santiment, the 30-day MA has crossed above the 50-day MA for this metric.
The gap between the two lines has widened since we wrote our latest Solana price forecast, indicating that wallets are being activated at a faster pace in the last few days compared to last month.
In previous instances, this has marked the beginning of a strong price move for Solana. Whether that is bullish or bearish depends on the price action, and, right now, a rejection of a move above $78 seems to be the most relevant technical move for the token.
Solana Price Forecast
Every new Solana analysis as it publishes, today's technical signal and key levels, live price — on one page.
See all Solana forecastsSolana Could Either Drop to $64 or Rise to $90
Looking at the daily chart, we can see that SOL still has a key support in sight that could cushion the latest drop.
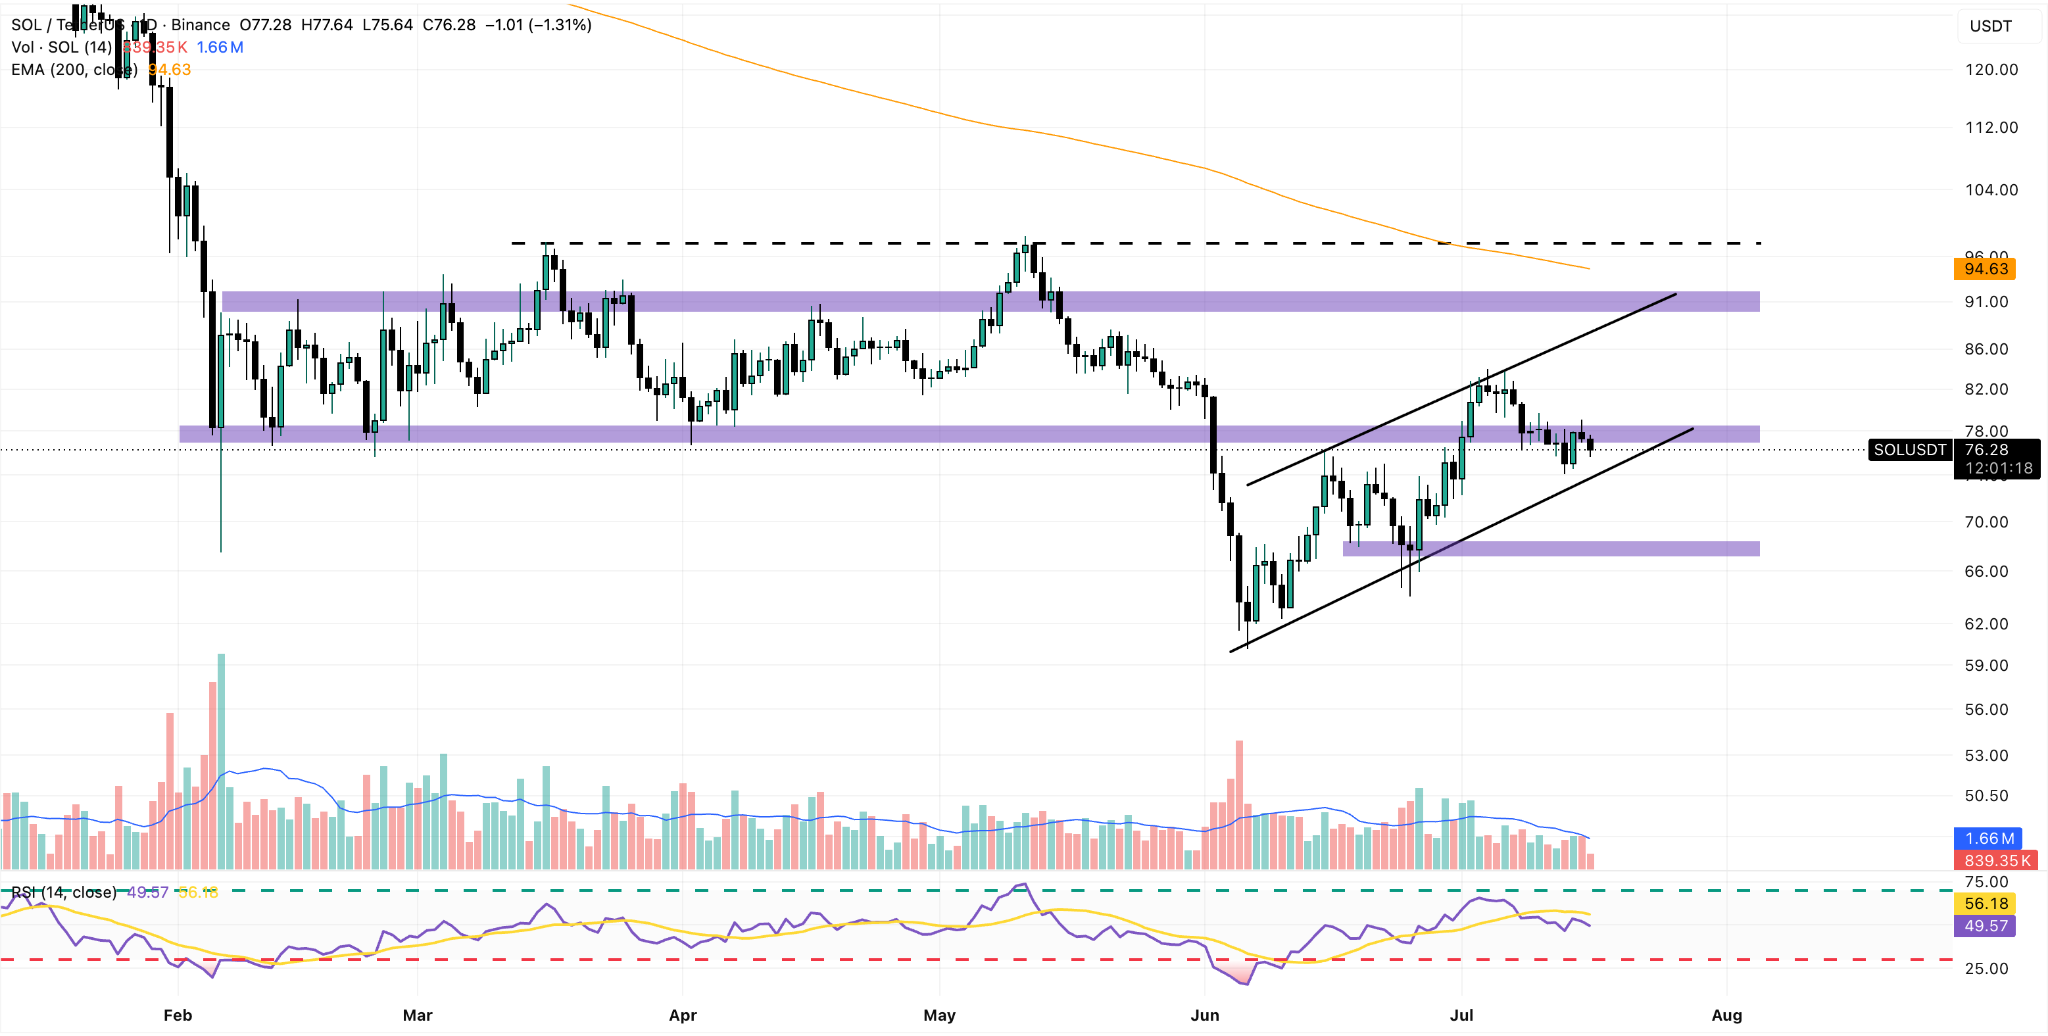
This trend line support sits at around $74, and it is the last line of defense for bulls to prevent a much stronger decline to $64.
The Relative Strength Index (RSI) has dipped to 49 and below the signal line, meaning that price momentum has turned bearish. If the oscillator declines to 40, that would confirm that bears have taken control of the narrative.
On the other hand, our bullish scenario sees SOL rising to $90 if the token breaks past that $78 mark. This would be the result of a short squeeze, as a significant volume of stop orders likely sits above this area.