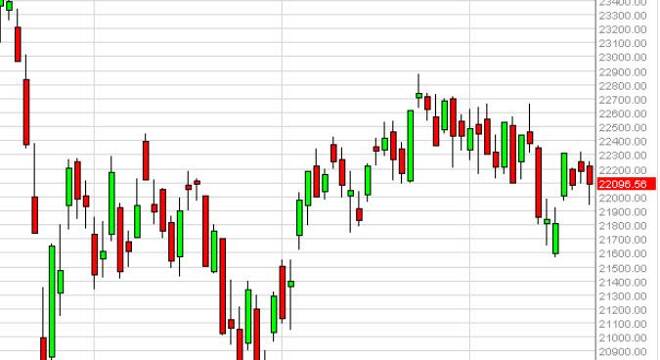
The MIB initially fell during the day on Friday, but then ended up finding enough support near the 21,900 level to turn things around and form a hammer.
The MIB initially fell during the day on Friday, but then ended up finding enough support near the 21,900 level to turn things around and form a hammer. The hammer of course is a bullish sign, so we can break above the 22,300 level, we feel the market then reaches towards the 22,800 level over the next several sessions. We believe that it’s only a matter of time before the market does breakout, so we have no interest in selling. Quite frankly, there is a gap just below that should continue to offer plenty of support.
MIB Forecast November 23, 2015, Technical Analysis
Chris is a proprietary trader with more than 20 years of experience across various markets, including currencies, indices and commodities. As a senior analyst at FXEmpire since the website’s early days, he offers readers advanced market perspectives to navigate today’s financial landscape with confidence.