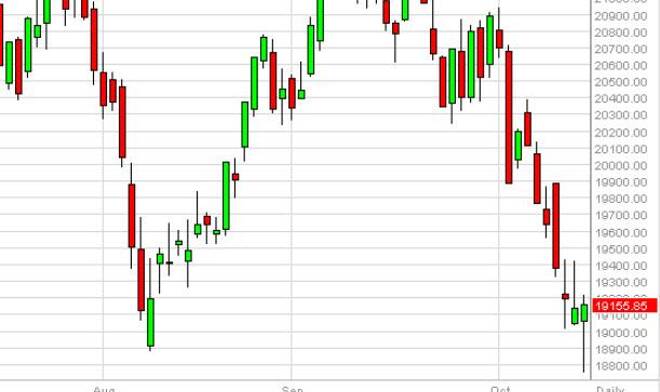
The MIB as you can see initially fell during the course of the day on Tuesday, breaking below the 19,000 level. However, we found enough support below to
The MIB as you can see initially fell during the course of the day on Tuesday, breaking below the 19,000 level. However, we found enough support below to turn things back around and form a hammer. Because of this, and the fact that we have the hammer preceded by a shooting star suggests that we are going to continue to go sideways in the neighborhood of 19,000 or so. Because of that, we don’t really necessarily have an interest in trading this market until we get above 19,500 to the upside, or a break below the 18,800 level to the downside.
Chris is a proprietary trader with more than 20 years of experience across various markets, including currencies, indices and commodities. As a senior analyst at FXEmpire since the website’s early days, he offers readers advanced market perspectives to navigate today’s financial landscape with confidence.