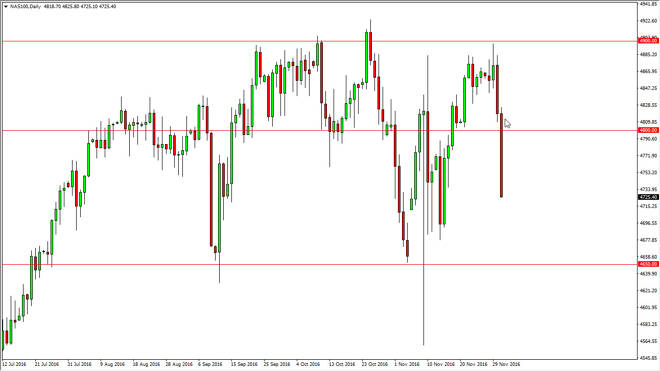
The NASDAQ 100 fell significantly during the course of Thursday, as we broke below the 4800 level and formed an extraordinarily negative candle. The 4650
The NASDAQ 100 fell significantly during the course of Thursday, as we broke below the 4800 level and formed an extraordinarily negative candle. The 4650 level below is massively supportive, so I think at that point in time we could get a bit of support and a potential bounce from there. At this moment, I’m not willing to step in front of the selling pressure as it would be “catching a falling knife”, and because of this I believe that the market is one that you should probably avoid at the moment, especially considering that the job numbers come out today.
Chris is a proprietary trader with more than 20 years of experience across various markets, including currencies, indices and commodities. As a senior analyst at FXEmpire since the website’s early days, he offers readers advanced market perspectives to navigate today’s financial landscape with confidence.