The NASDAQ 100 went back and forth during the course of the session on Friday, bouncing off of the 4800 level. Ultimately, the market continues to see
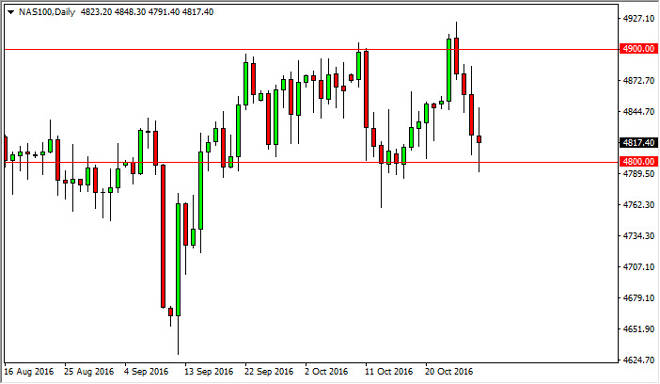
The NASDAQ 100 went back and forth during the course of the session on Friday, bouncing off of the 4800 level. Ultimately, the market continues to see quite a bit of pressure in both directions, but at this point in time it looks as if we will probably continue to seek negative pressure in the short-term, followed by a bounce. Am waiting to see a supportive candle that I can go long based upon, but may have to look to very short-term charts in order to take advantage of it. A break down below the 4750 level is negative.
Chris is a proprietary trader with more than 20 years of experience across various markets, including currencies, indices and commodities. As a senior analyst at FXEmpire since the website’s early days, he offers readers advanced market perspectives to navigate today’s financial landscape with confidence.