Looking at the NASDAQ 100 futures on a weekly chart, you can see that the last five sessions have been somewhat negative, but we have found support at the
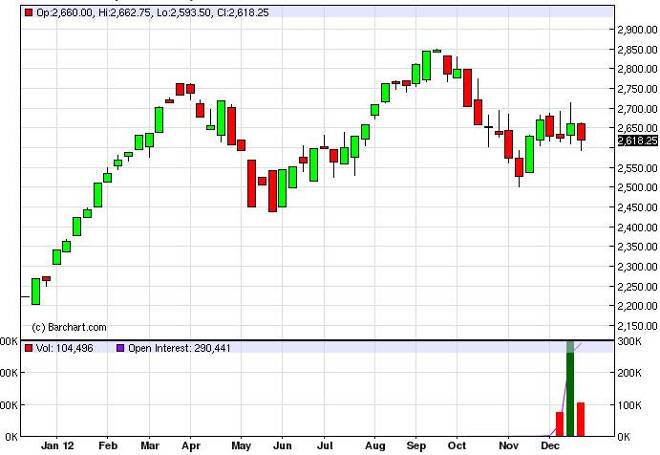
Looking at the NASDAQ 100 futures on a weekly chart, you can see that the last five sessions have been somewhat negative, but we have found support at the 2600 level. Looking out we can see that the 2700 level looks to be very resistive, and as a result a break above that level would be extremely bullish. This is predicated upon the two previous weeks that showed a shooting star failing right at that level.
If we managed to break down below the 2600 level, we think that the market will probably go searching for 2500 in relatively short order. If we break down below there, we could really start to fall quickly.
NASDAQ 100 Futures forecast for the week of December 31, 2012, Technical Analysis
Chris is a proprietary trader with more than 20 years of experience across various markets, including currencies, indices and commodities. As a senior analyst at FXEmpire since the website’s early days, he offers readers advanced market perspectives to navigate today’s financial landscape with confidence.