



These developments, coupled with a positive demand outlook from the International Energy Agency, suggest a nuanced impact on both Natural Gas and Oil forecasts, indicating a cautious yet optimistic market sentiment.
Natural Gas Price Forecast
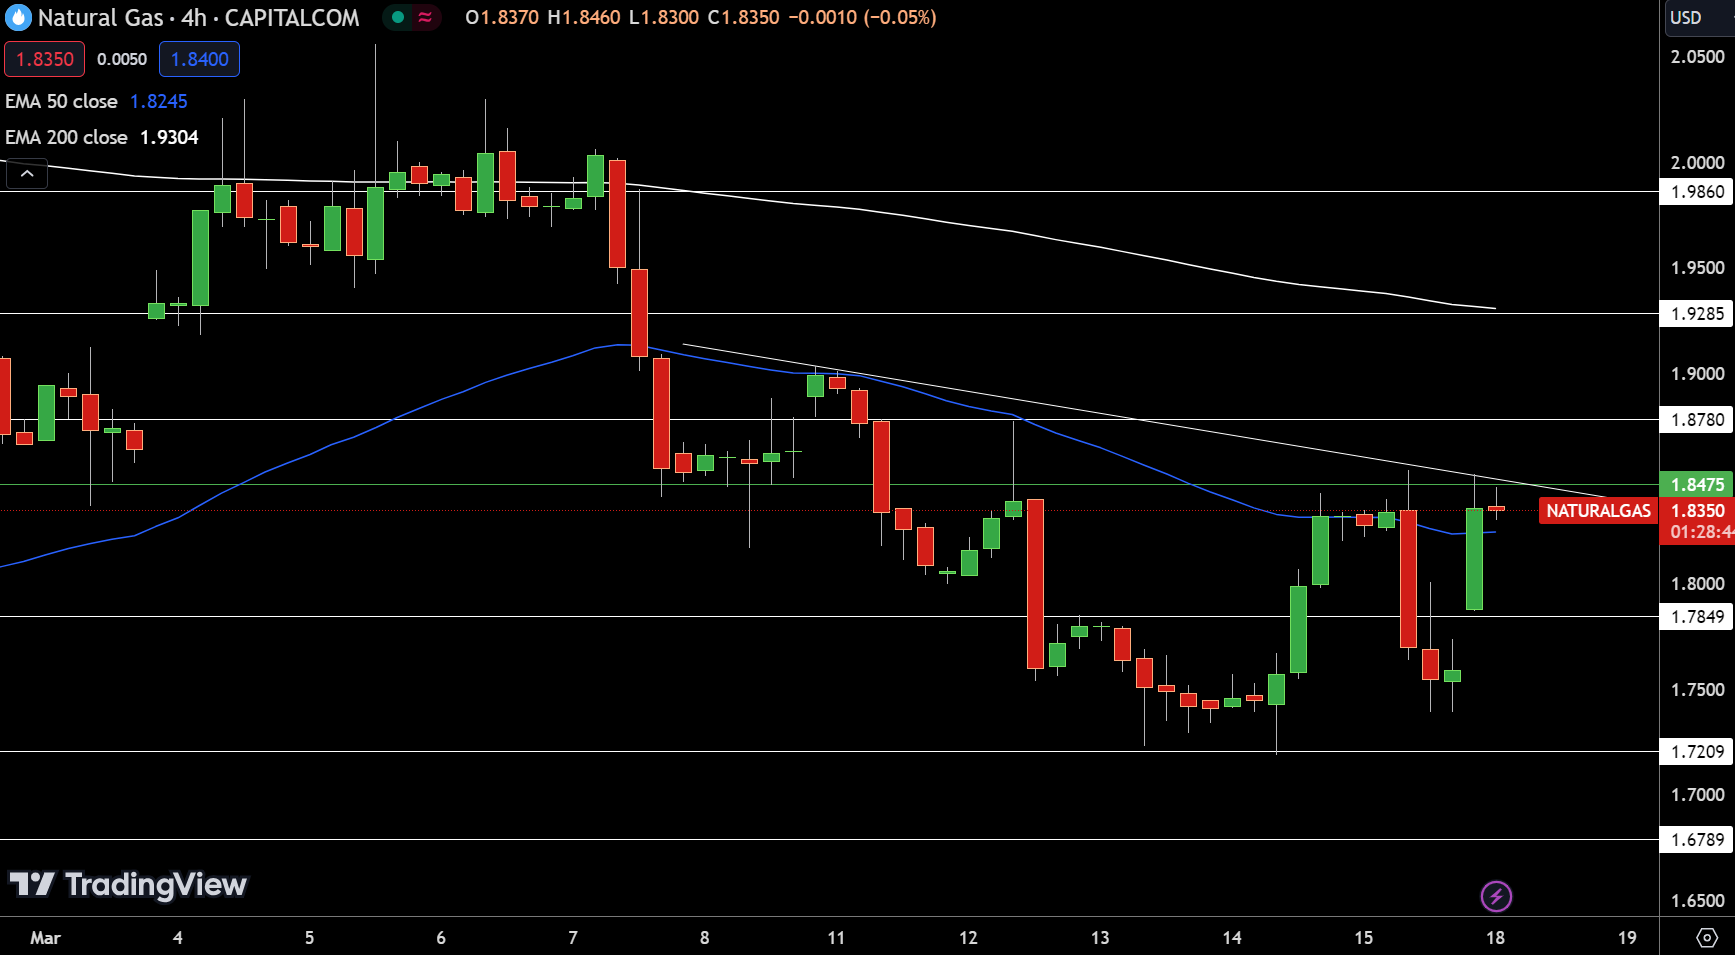
Natural Gas (NG) prices surged by 4.38%, reaching $1.83. This significant increase brings the commodity near its pivot point of $1.85, indicating a potential shift in market sentiment.
Resistance levels are identified at $1.88, $1.93, and $1.99, suggesting that upward momentum may face hurdles. On the downside, support at $1.78, followed by $1.72 and $1.68, provides a cushion against declines.
The 50-Day Exponential Moving Average (EMA) at $1.82 and the 200-Day EMA at $1.93 paint a mixed picture, implying a cautious outlook. A move above $1.85 could signal a more definitive bullish turn, whereas failure to breach this level may reinforce a bearish stance.
WTI Oil Price Forecast
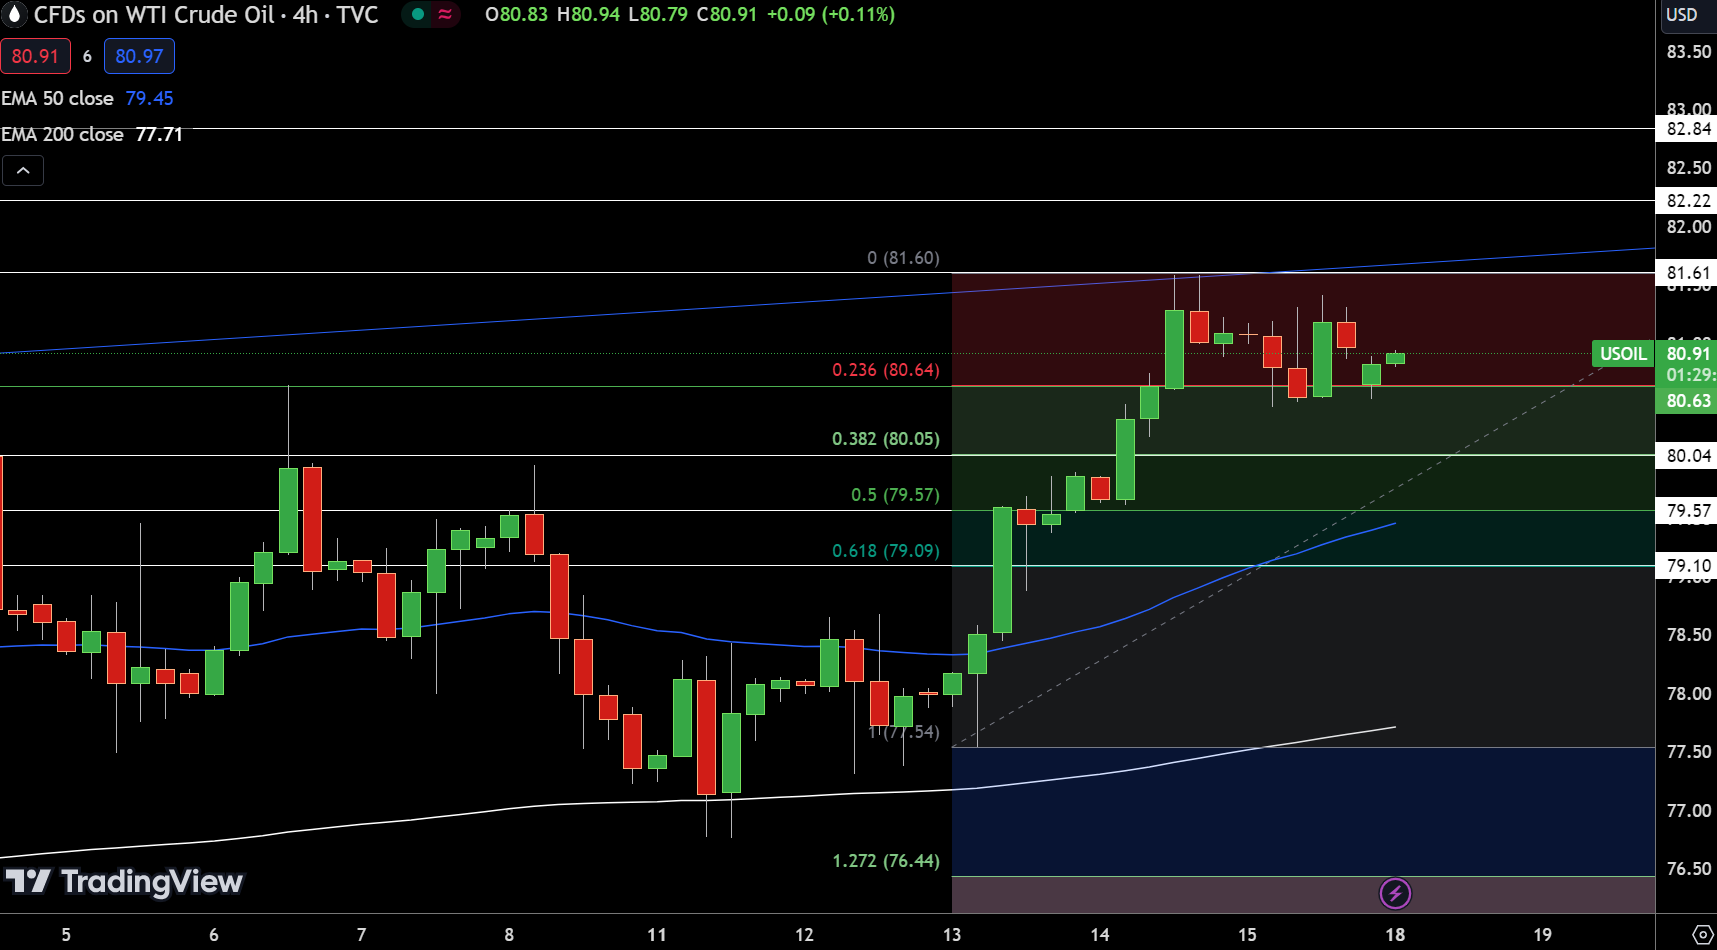
The 50-Day Exponential Moving Average (EMA) at $79.45 and the 200-Day EMA at $77.71 both underscore a prevailing bullish sentiment. However, a fall below $80.63 could catalyze a significant bearish shift, underscoring a delicate balance in the current market dynamics.
Brent Oil Price Forecast
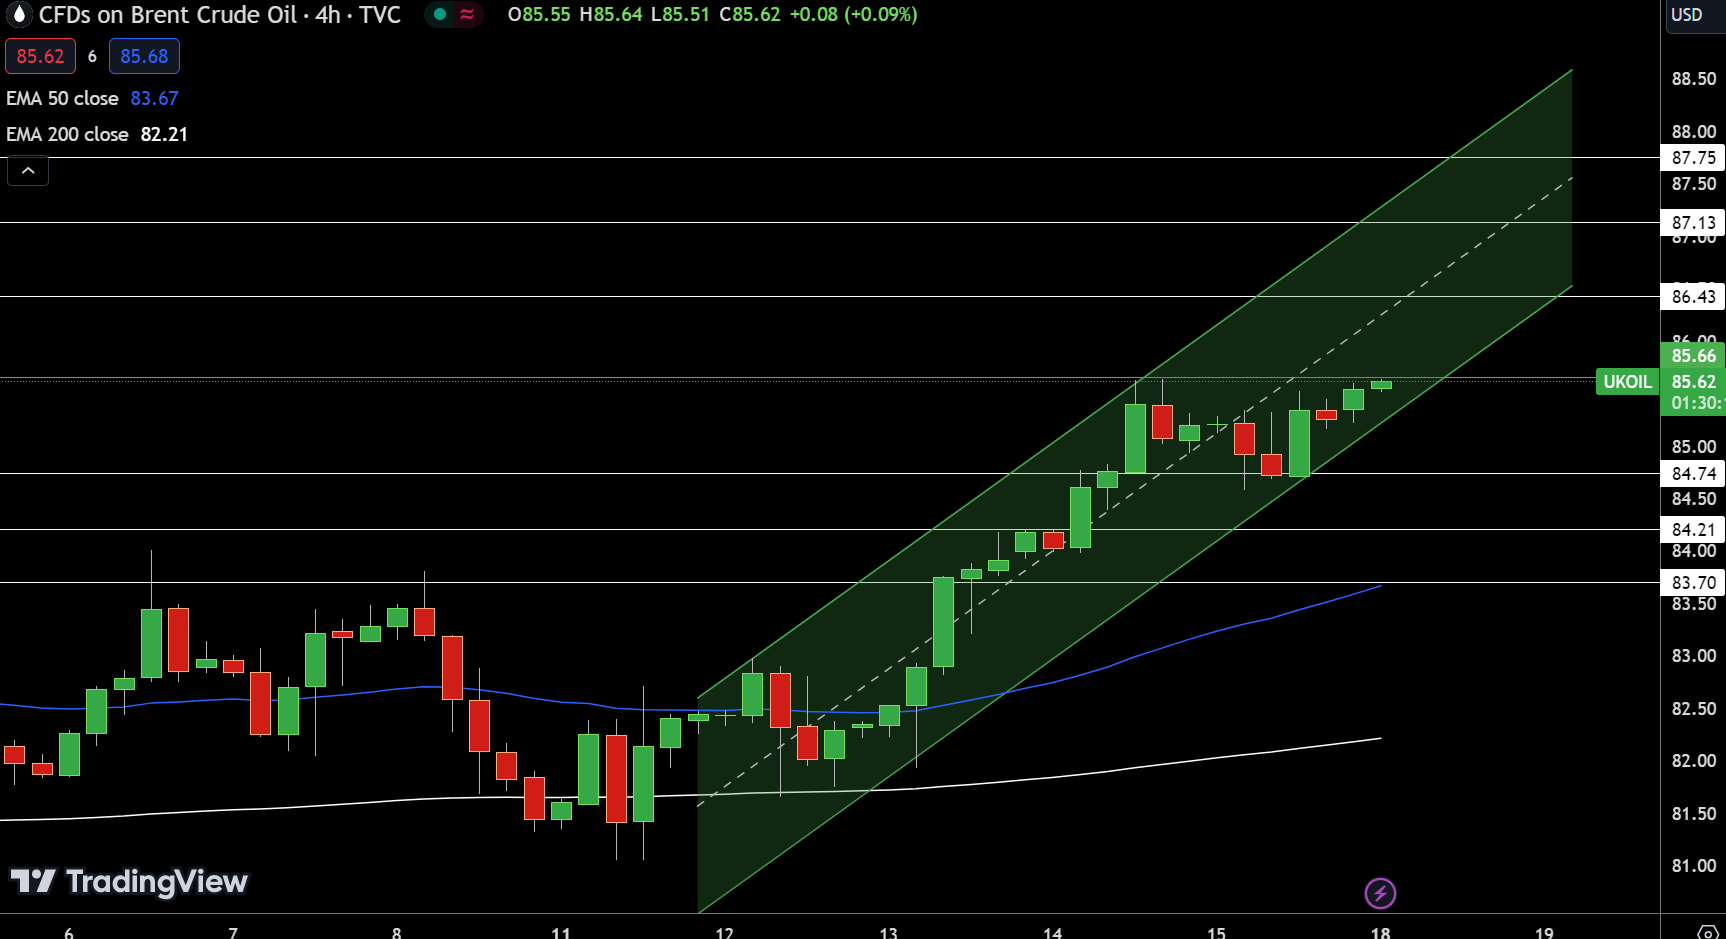
However, should UKOIL fall below its pivot point, a notable shift towards a bearish trend could be triggered, highlighting the market’s current sensitivity to pivotal levels.
For a look at all of today’s economic events, check out our economic calendar.


