
Rising demand in Asia also supported prices. However, U.S. data showing fewer unemployment claims might keep interest rates unchanged, potentially limiting oil demand growth.
This bullish outlook for oil, supported by higher demand and lower inventories, signals potential price increases for both natural gas and oil, influenced by broader economic and geopolitical factors.
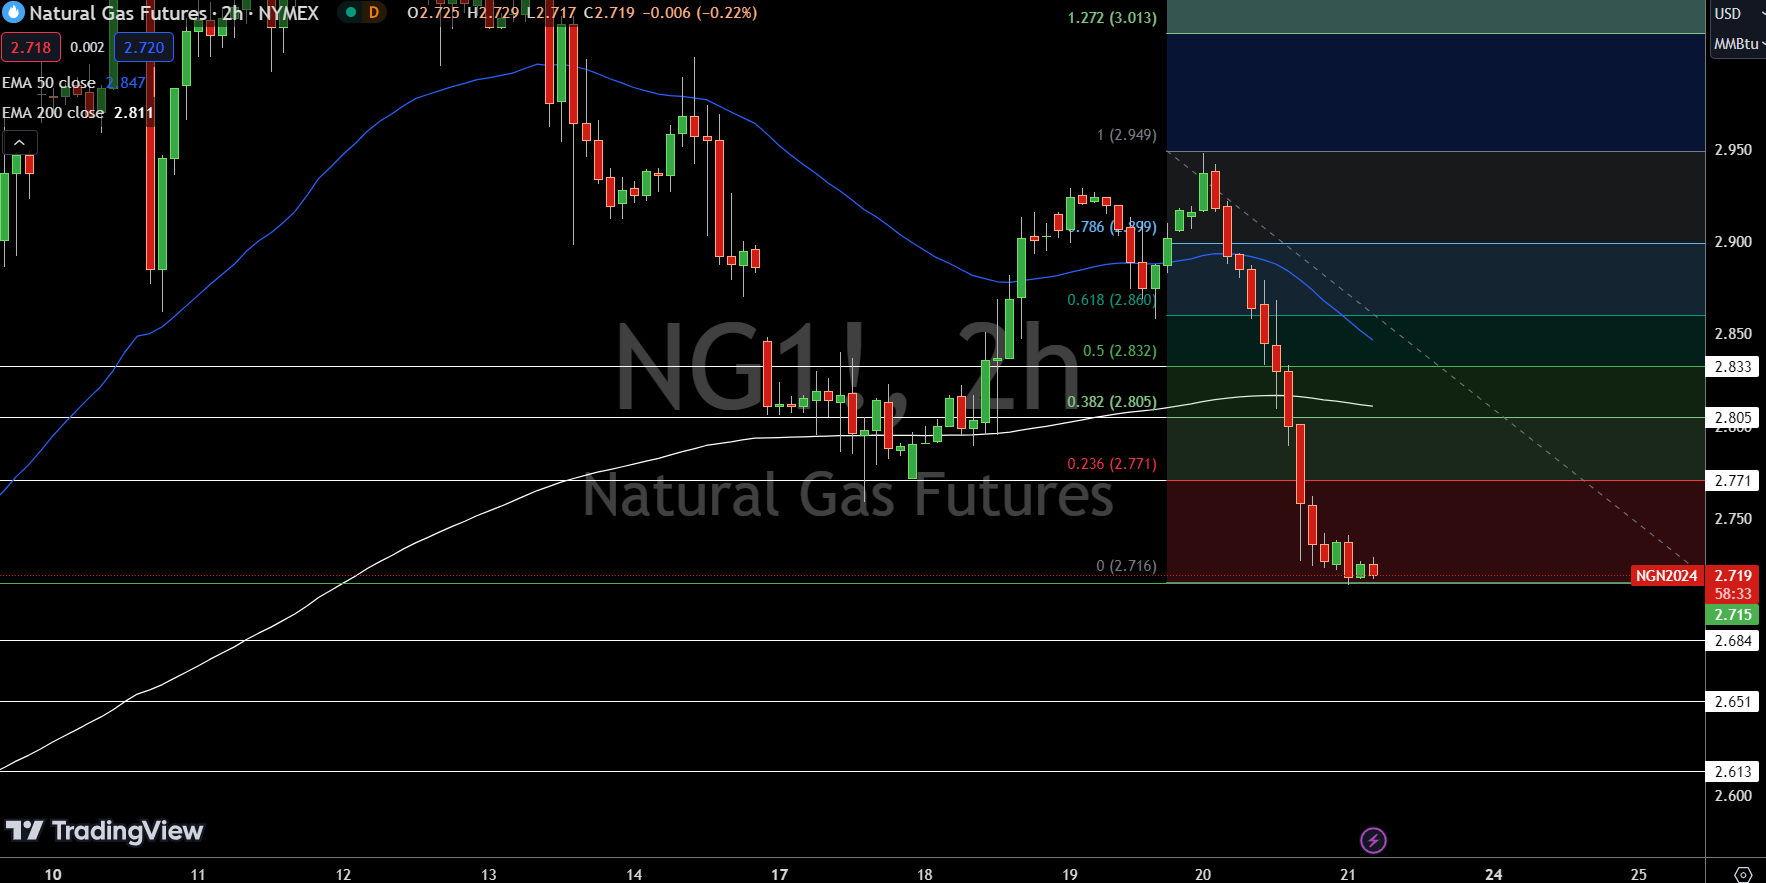
Natural Gas (NG) is priced at $2.719, reflecting a 0.22% decline in the last two hours. The pivot point is at $2.715, marking a critical level. Immediate resistance is observed at $2.771, followed by $2.805 and $2.833.
Support levels are identified at $2.684, $2.651, and $2.613. Technical indicators reveal the 50-day EMA at $2.847 and the 200-day EMA at $2.811, indicating bearish momentum.
The bullish outlook hinges on maintaining above $2.715; a drop below this level could trigger substantial selling pressure.
WTI Oil Price Forecast
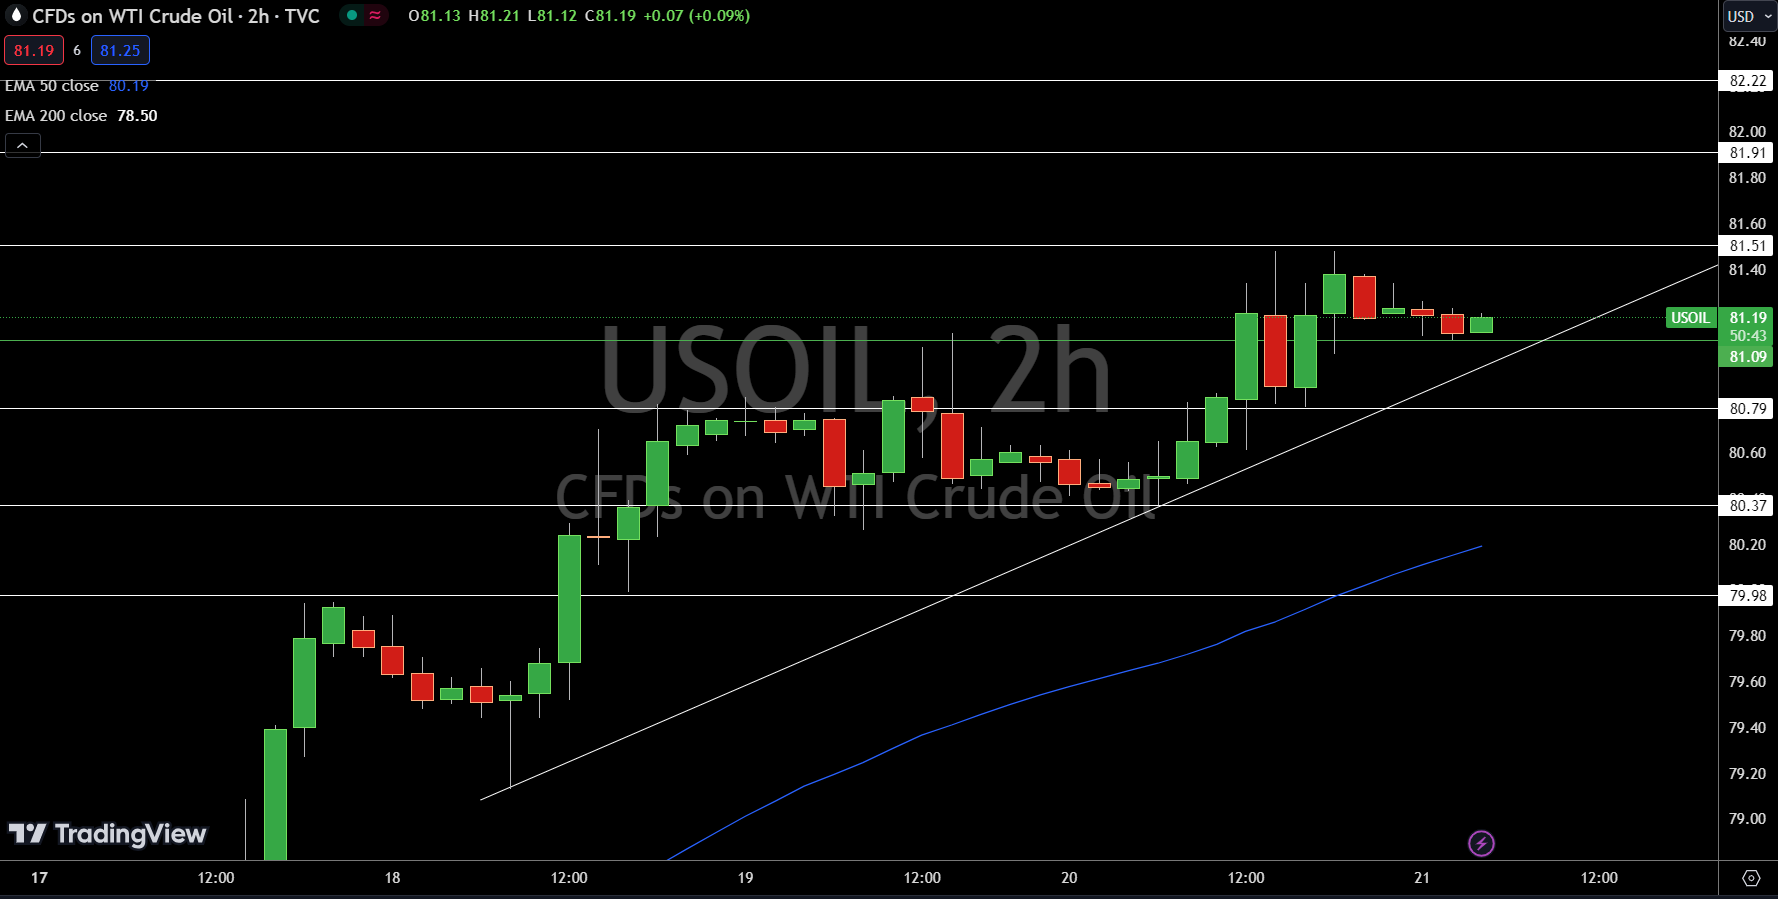
WTI crude oil (USOIL) is currently priced at $81.19, displaying a bullish sentiment. The pivot point at $81.09 serves as a critical marker. Immediate resistance is noted at $80.79, followed by $80.37 and $79.98.
On the support side, levels are positioned at $81.51, $81.91, and $82.22. Technical indicators highlight the 50-day EMA at $80.19 and the 200-day EMA at $78.50, suggesting upward momentum.
The bullish outlook is contingent on maintaining above $81.09; a break below this pivot could trigger a significant downward trend.
Brent Oil Price Forecast
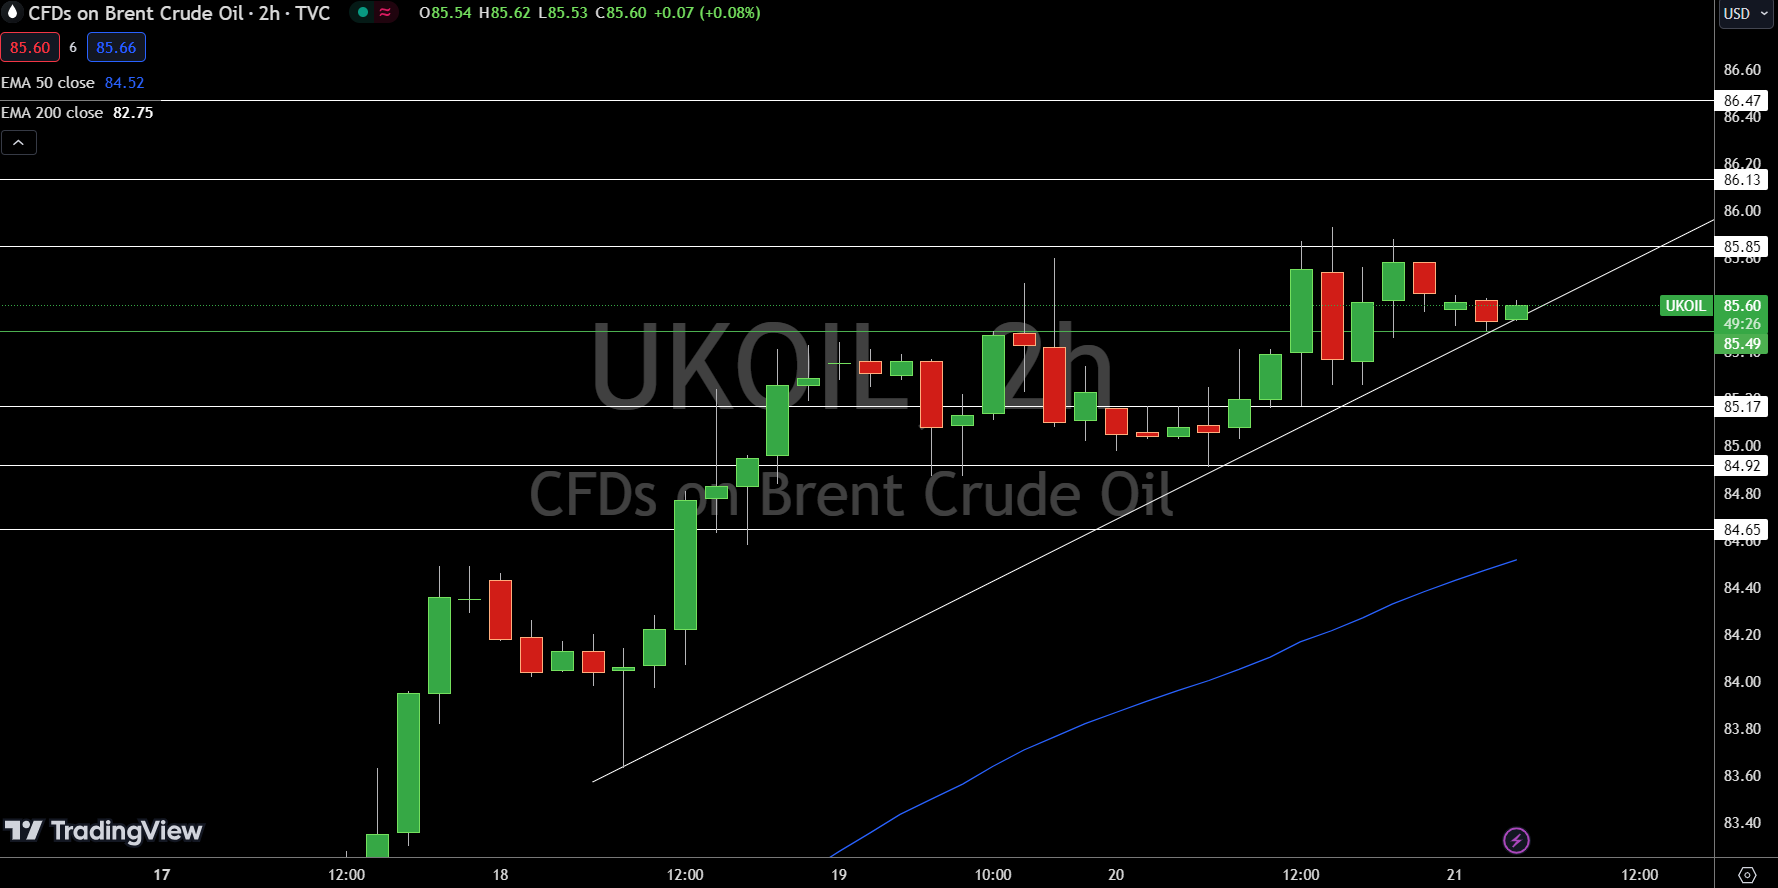
Brent oil (UKOIL) is priced at $81.19, indicating a bullish trend. The pivot point stands at $85.49. Immediate resistance levels are set at $85.85, $86.13, and $86.47. On the downside, support levels are noted at $85.17, $84.92, and $84.65.
Technical indicators show the 50-day EMA at $84.52 and the 200-day EMA at $82.75, reinforcing the bullish outlook.
Holding above the $85.49 pivot point is crucial; a breach below this level may lead to significant selling pressure.
For a look at all of today’s economic events, check out our economic calendar.