



Additionally, upcoming U.S. economic reports will provide further insights into the Federal Reserve’s monetary policy decisions, potentially influencing future oil and natural gas forecasts.
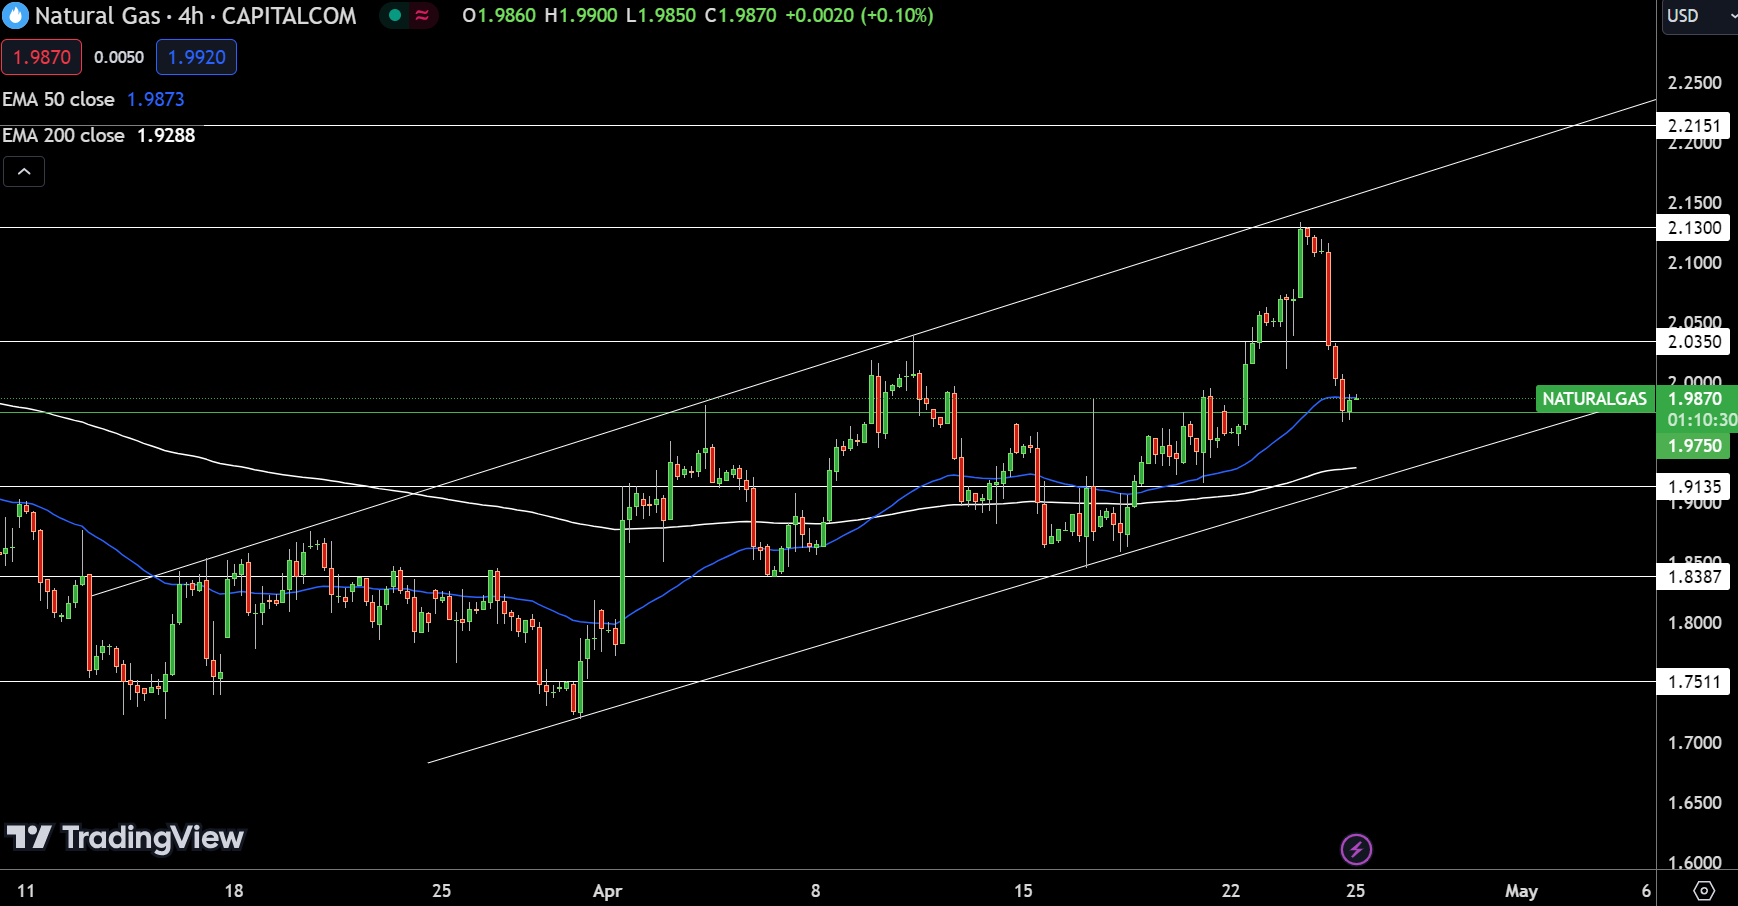
Natural Gas (NG) is trading up today at $1.9870, a gain of 0.56%. Currently, it hovers slightly above its pivot point of $1.98, hinting at a potential bullish trend. Resistance levels to watch are at $2.04, $2.13, and $2.22. Conversely, should the price fall, support might be found at $1.91, followed by stronger levels at $1.84 and $1.75.
The technical analysis is supported by the 50-Day Exponential Moving Average (EMA) at $1.99 and the 200-Day EMA at $1.93, both suggesting that prices could maintain current levels. The market is bullish as long as it remains above $1.98; however, dipping below this threshold could lead to a significant sell-off.
WTI Oil Price Forecast
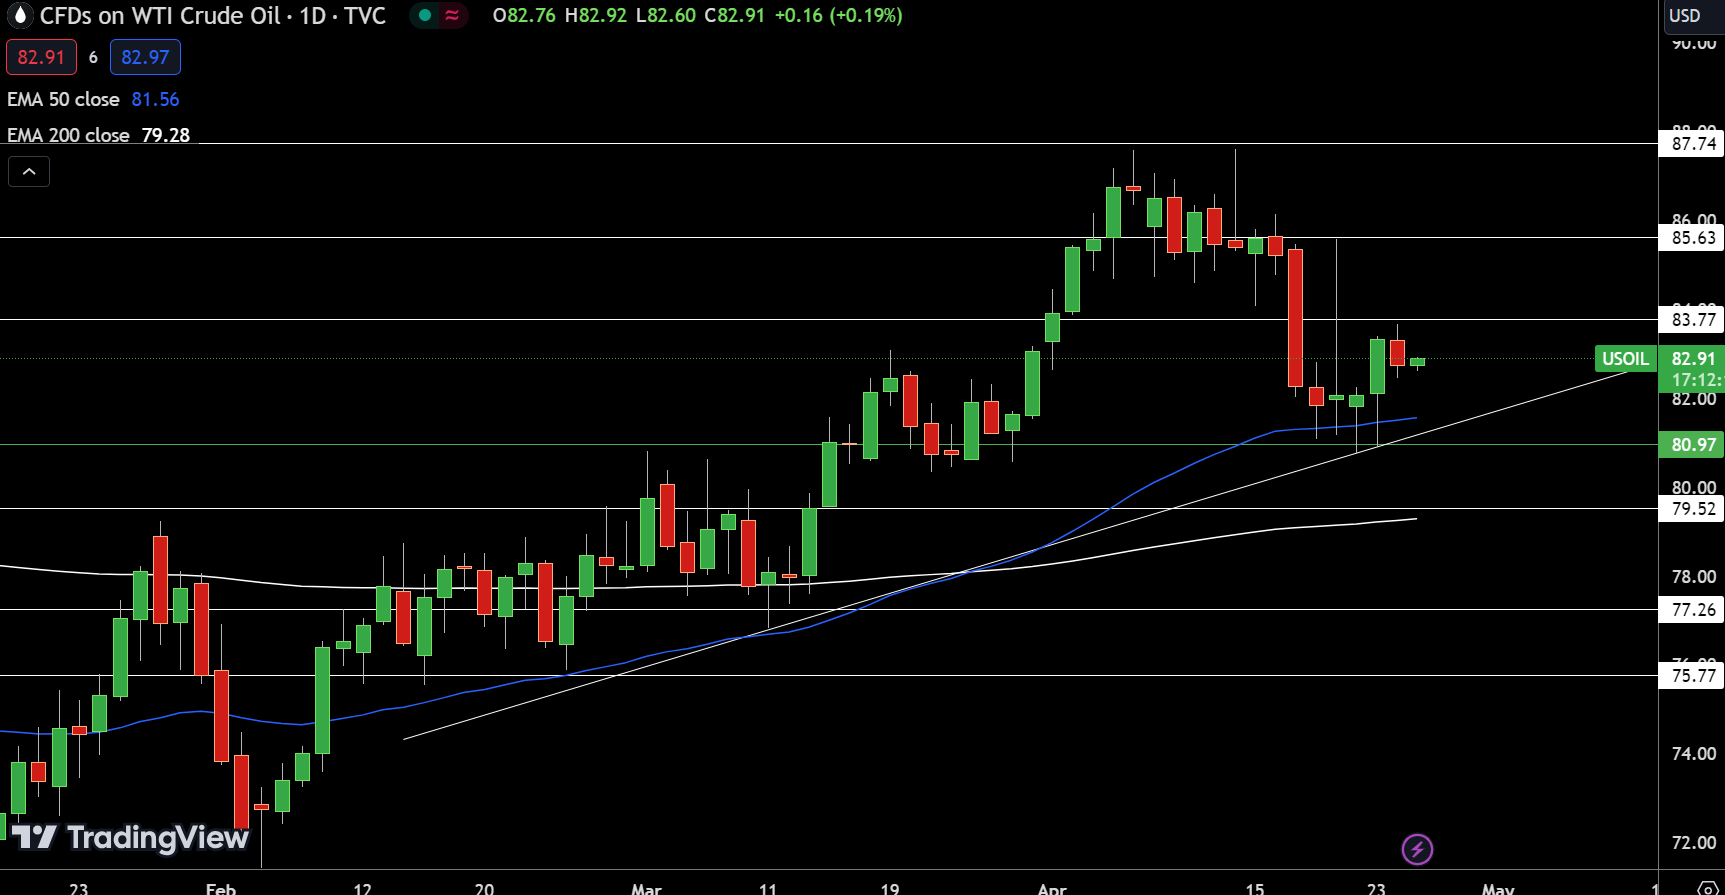
Today, USOIL is trading at $82.91, showing a modest increase of 0.17%. The commodity is currently positioned above its pivot point at $80.97, suggesting bullish momentum. Looking ahead, key resistance levels are set at $83.77, $85.63, and $87.74. Should the price decline, it will find support at $79.52, followed by $77.26 and $75.77.
The technical indicators reinforce this outlook: the 50-day Exponential Moving Average (EMA) stands at $81.56, while the 200-day EMA is at $79.28, both supporting the current uptrend. The market remains bullish above the $81 mark, but falling below this threshold could prompt a significant sell-off.
Brent Oil Price Forecast
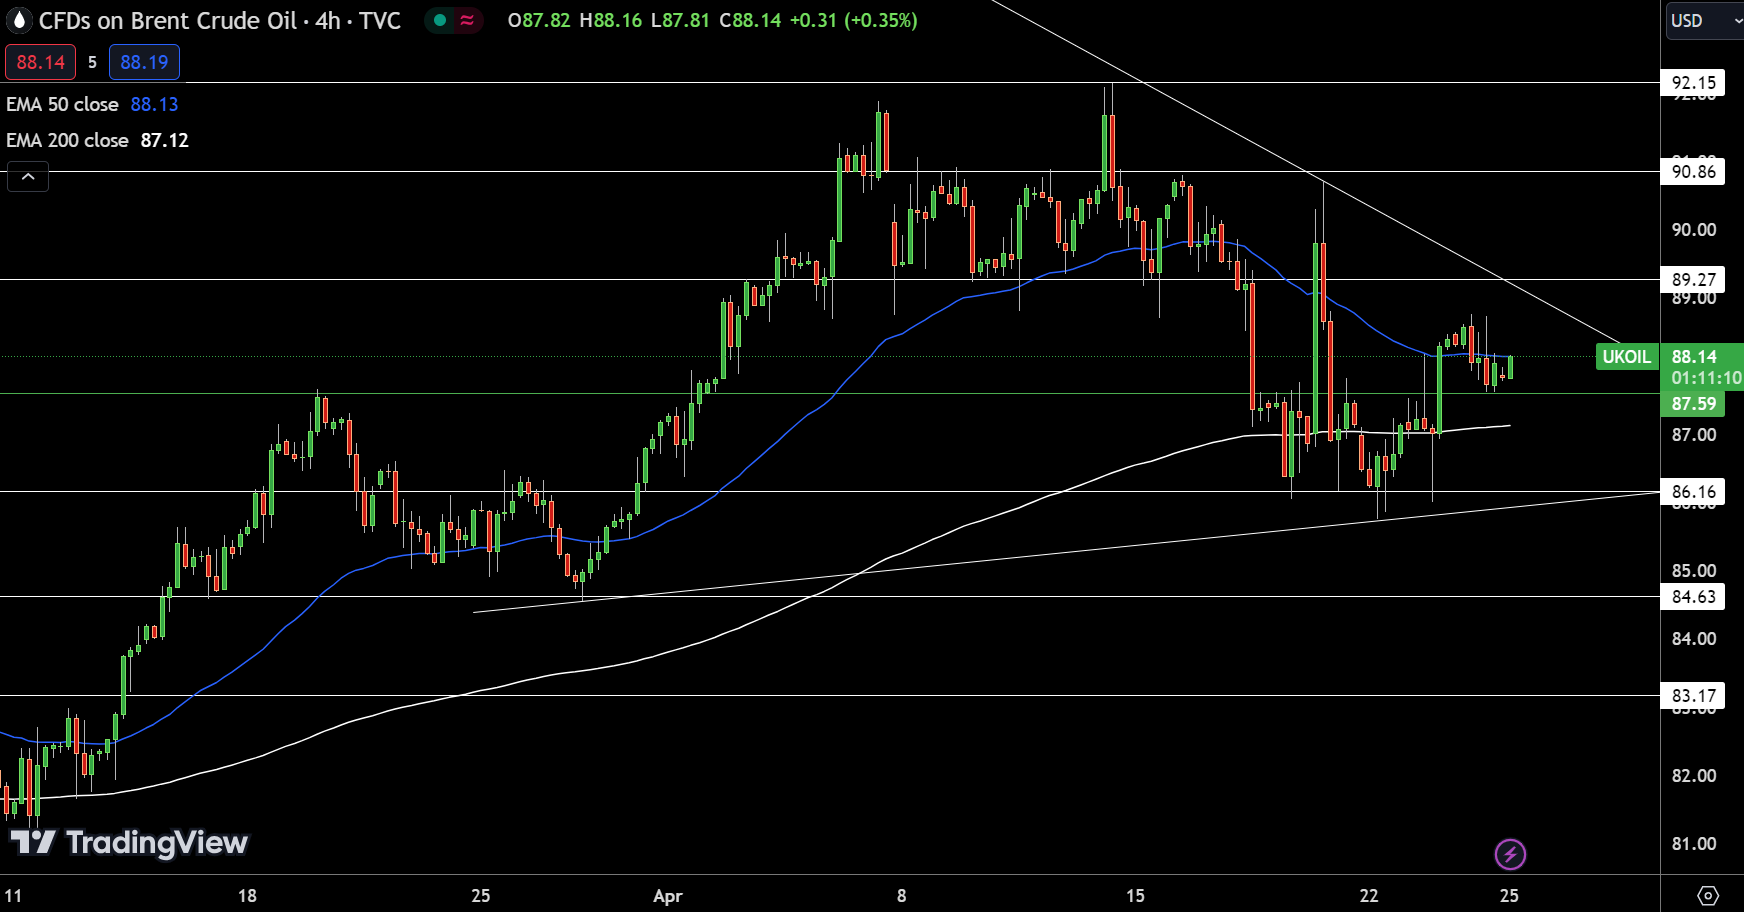
Technical indicators underline the bullish sentiment: the 50-day Exponential Moving Average (EMA) is at $88.13, closely aligned with today’s price, and the 200-day EMA at $87.12 supports the upward trend. A stable hold above $87.60 indicates continued bullishness, whereas a drop below this could trigger a sharp decline in prices.
For a look at all of today’s economic events, check out our economic calendar.


